Download presentation
Presentation is loading. Please wait.

1
Data Available through ASSIST, National Student Clearinghouse, and EMSI Neph Ahimera Senior Research Analyst, IERG Catherine Hernandez Workforce Development and Vocational Research Analyst, IERG

2
1. National Student Clearinghouse An Independent Non-Profit 501© (6) Association founded by the Higher Education Community Created in 1993 to facilitate the flow of students data
 Association founded by the Higher Education Community Created in 1993 to facilitate the flow of students data.")
3
NSC MISSION To facilitate the exchange and understanding of student enrollment, performance, and related information in support of the education community

4
NSC DATABASE (2009) 92% of nation’s enrollment 16+ million currently enrolled students 3,200+ colleges and universities Data refreshed 8-10 times a year (3- 4 times/term) 2,000+ high schools 80+ million historic records
 92% of nation’s enrollment 16+ million currently enrolled students 3,200+ colleges and universities Data refreshed 8-10 times a year (3- 4 times/term) 2,000+ high schools 80+ million historic records")
5
NSC SERVICES Core Services: basic web access Student Self Service: –Enrollment online update Student Tracker –Prior and subsequent enrollment –Financial aid Enrollment Verify: Subsequent enrollment Degree Verify: Online update and research Transcript Ordering

6
QUESTIONS ASKED…. Did admission applicants enroll in another college? Did students no longer enrolled at my institution transfer out or drop out? Did those students graduate? What degree (s) did they earn? Did they go to graduate school?
 did they earn. Did they go to graduate school .")
7
WHAT IS STUDENTTRACKER? Educational research and analysis tool that puts the clearinghouse at your fingertips. Batch data File Exchange On-line Inquiry

8
HOW DOES IT WORK? Colleges subscribe to Student Tracker annually NSC provides online access and batch procedures via Excel or Flat file format Schools run reports as often as they choose and receive NSC data Users analyze data to identify trends and make decisions

9
STUDENTTRACKER USERS Presidents Admissions Directors Research and Planning Officers Enrollment Management Directors Academic Assessment Officers Registrars Financial Aid Directors Alumni/Foundation Directors

10
STUDENTTRACKER QUERY TYPES Track students who apply but do not enroll Track subsequent enrollment and degrees of transfers and graduated students Track concurrent enrollment Determine cohort graduation rates Track applied students down to the academic program of study level Track graduates in specific disciplines

11
The Control Report The control report provides an overview of your StudentTracker inquiry results, including the number of students for whom enrollment information was found in Clearinghouse database

13
The Aggregate Report Provides a summary of the first schools attended by the students that you submitted to NSC for whom data were available in the database.

16
The Detail Report Provides specific enrollment information and a graduation indicator for each student that was submitted and for whom data were available in the Clearinghouse database.

17
SECURITY AND PRIVACY Release of students records by institutions to NSC is approved by U.S. Dept. of Education StudentTracker approved by FERPA compliant by U.S. Dept. of Education Only, directory Information is disclosed, where required Student FERPA blocks honored as required Additional services designed with FERPA as top priority Electronic security measures taken

18
2. ASSIST Arizona State System for Information on Student Transfer Statewide relational data warehouse containing enrollment and degree information on students attending Arizona’s public universities and community college districts. It allows institutions to track students as they move through Arizona’s higher education system Fully implemented in 2000

19
WHY USE ASSIST? ASSIST provides information to assess the effectiveness of AZ’s general education curriculum and transfer articulation model. ASSIST allows institutions to evaluate course sequence successes. ASSIST provides the means to meet state and federal reporting requirements in a cost-effective way. ASSIST serves as a valuable decision support tool for institutional policy makers

20
TYPES OF DATA AVAILABLE Demographic data: –Age –Arizona Residency Type –Gender – Ethnicity –Minority Status – HS Year and Diploma Type – US visa type –Placement Test Scores

21
TYPES OF DATA (cont’d) Enrollment and Transfer data: – AGEC Enrollment Type – Major by term – Term and cumulative GPA – Transfer hours – Developmental hours attempted or completed by term – Transfer Institution(s) –Number of AZ CC Institutions attended
 Enrollment and Transfer data: – AGEC Enrollment Type – Major by term – Term and cumulative GPA – Transfer hours – Developmental hours attempted or completed by term – Transfer Institution(s) –Number of AZ CC Institutions attended")
22
TYPES OF DATA (cont’d) Course data –Course enrollment by term –Course completion and grade. Degree Data –AGEC completion type –AGEC completion year –Associate degree type –Associate degree year –Bachelor degree type –Bachelor degree semester

23
QUESTION TYPES How many of our CC students transfer to an Arizona public University? What majors do they select? How well do they perform in their 1 st term? How well do they do is specific classes? How many transfers complete a baccalaureate degree? What types of degrees do they complete? What is the completion rate of new full- time degree seeking students?

24
PRIVACY Only employees of the institution can obtain authorization to access that institution’s student data. Authorized ASSIST users must sign non-disclosure agreements. Institutions can access only the records of students who once attended their college. Students are tracked by anonymous ID Data used only for research and evaluation on transfer related issue.

25
3. EMSI Economic Modeling Specialist Inc. (EMSI)
")
26
EMSI specializes in detailed information about regional economies for assessment and planning purposes, bringing together industry, workforce and education perspectives.

27
EMSI A data base that provides: Regional and Labor Market data Web based Analysis Tools Data driven reports Modeling tools for simulating the full impact of industry changes on regional economies College Return on Investment College Return on Investment

28
Data Source EMSI cuts through hard to use and incomplete data sets by integrating and improving on 70 state and federal government sources. Its data base is updated twice annually with data that is no more than 6 months old. Data is available from state and county levels all the way down to individual ZIP code or city.

29
EMSI Structure The EMSI program is comprised of 4 modules which can be customized to fit our organization’s needs Economic Forecaster Economic Impact Career Pathways Educational Analyst

30
Economic Forecaster The economic forecaster is the primary data center and is broken out into four sections: Industry tool Occupational tool Demographic tool Economy tool

31
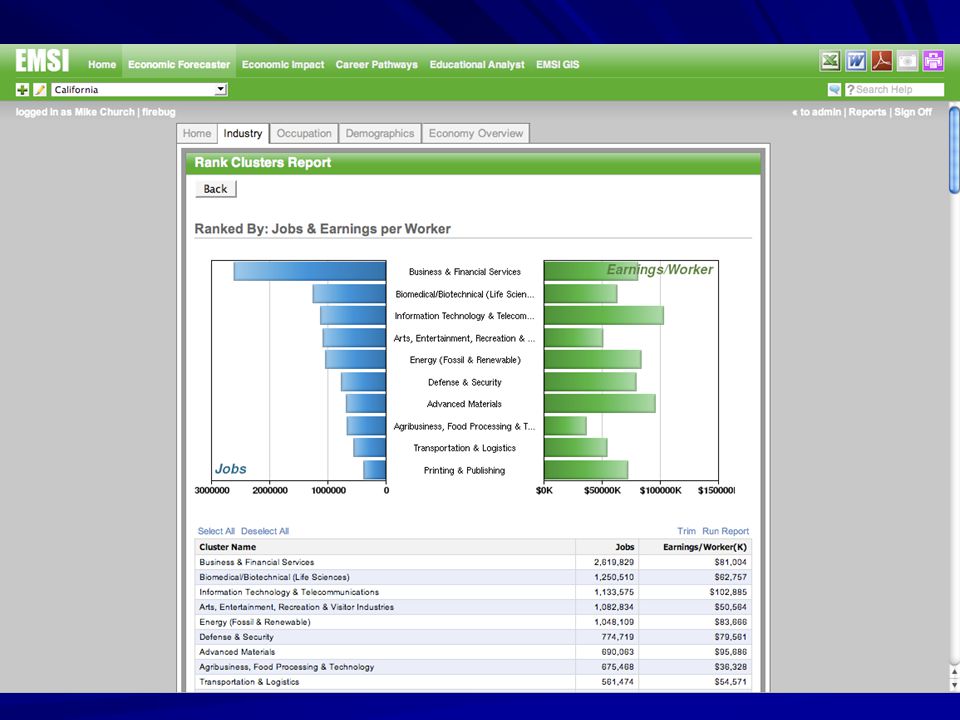
Industry tool The Industry tool allows you to view current and forecasted data for various industries in a region including job growth/decline, unemployment, earnings per worker, establishments, industry concentration, competitiveness, staffing patterns, and more. The tool allows you to run most reports for any custom collection of one or more industries at various levels of industry detail. The Industry tool allows you to view current and forecasted data for various industries in a region including job growth/decline, unemployment, earnings per worker, establishments, industry concentration, competitiveness, staffing patterns, and more. The tool allows you to run most reports for any custom collection of one or more industries at various levels of industry detail.

32
Occupation tool The Occupation tool allows you to view current and projected data for various Standard occupational classifications (jobs) in our region, including occupation growth/decline, earnings, competitiveness, industry concentration, unemployment by occupation group, inverse staffing patterns and more.
 in our region, including occupation growth/decline, earnings, competitiveness, industry concentration, unemployment by occupation group, inverse staffing patterns and more.")
33
Demographic tools The Demographic tool provides an interface to published and projected regional demographic data consisting of current and projected population numbers by gender, age, and ethnicity.

34
Economy Overview tool The Economy Overview tool allows you to generate an instant, high level overview of your region’s industries, occupation and demographics.

35
Economic Impact For economic development, workforce, and educational professionals, the Economic Impact is a critical tool for understanding a region’s current economy and planning for future economic challenges and opportunities. It is divided into three sections: Input-Output tool Economic Base tool Economic Base tool Economic Indicator tool Economic Indicator tool

36
Input-Output tool The Input-Output tool simulates total jobs gained or lost due to changes in one or more industry. You can analyze, compare and run scenarios on industries or clusters. It can suggest the best industries to add or develop in a cluster.

37
Economic Base tool The Economic Base tool defines and analyzes the regional industry clusters and economic base. This gives an in depth report on the current state of our economy.

38
Economic Indicators tool The Economic Indicators tool analyzes the economic indicators in a number of areas for a given region to discover the highest impact industries.

39
Career Pathways –Not in our package

40
Educational Analyst The Educational Analyst module is designed to help regional workforce, education, and training professionals access the information they need to plan for the region’s future knowledge and skill needs. It matches occupations to post-secondary programs. It can be divided into four sections. Program tool Program tool Peer Comparison tool Peer Comparison tool Career Clusters Tool Career Clusters Tool Educational Capital tool Educational Capital tool

41
Program tool The Program tool is a powerful strategic planning asset for education and workforce professionals because it accesses high-resolution labor market data and links it to post-secondary programs of study. It presents an overview and 10 year outlook for all occupations served by a specific program.

42
Peer Comparison tool The Peer Comparison tool gives college leaders and researchers the ability to benchmark dozens of institutional characteristics against any other institution in the country.

43
Career Cluster tool The Career Cluster tool allows us to view labor market data aggregated by career clusters which are an increasingly important model in education and workforce development. Career clusters are useful models that group occupation with similar skill and interest requirement, and define pathways of career advancement with each cluster. This may prove to be an important tool for the Carl Perkins and technical education programs.

44
Educational Capital tool The Educational Capital tool provides vital information about a region’s current and projected educational attainment and high school graduations. It will generate an overview of which demographic groups can most benefit by attaining certain educational attainment levels, and how many potential college students the region has.

49
Sample Questions What are the new programs with high workforce demand? What are the important regional industries? What career pathways to recommend to dislocated workers? What are the high wage, high growth occupations in our area?

50
Questions? Neph Ahimera Senior Research Analyst, IERG Catherine Hernandez Workforce Development and Vocational Research Analyst, IERG

Similar presentations


 was created as a result of P.A. 04- 220 (An Act Concerning Allied Health Needs) to conduct.>")
