Download presentation
Presentation is loading. Please wait.

1
Vr: A New Index to Represent the Regional Geomagnetic Activity Dongmei Yang, Yufei He, Chuanhua Chen, Yahong Yuan 2010-9-21 Changchun

2
Outline Introduction Data Processing Results and Discussion Conclusion

3
Outline Introduction Data Processing Results and Discussion Conclusion

5
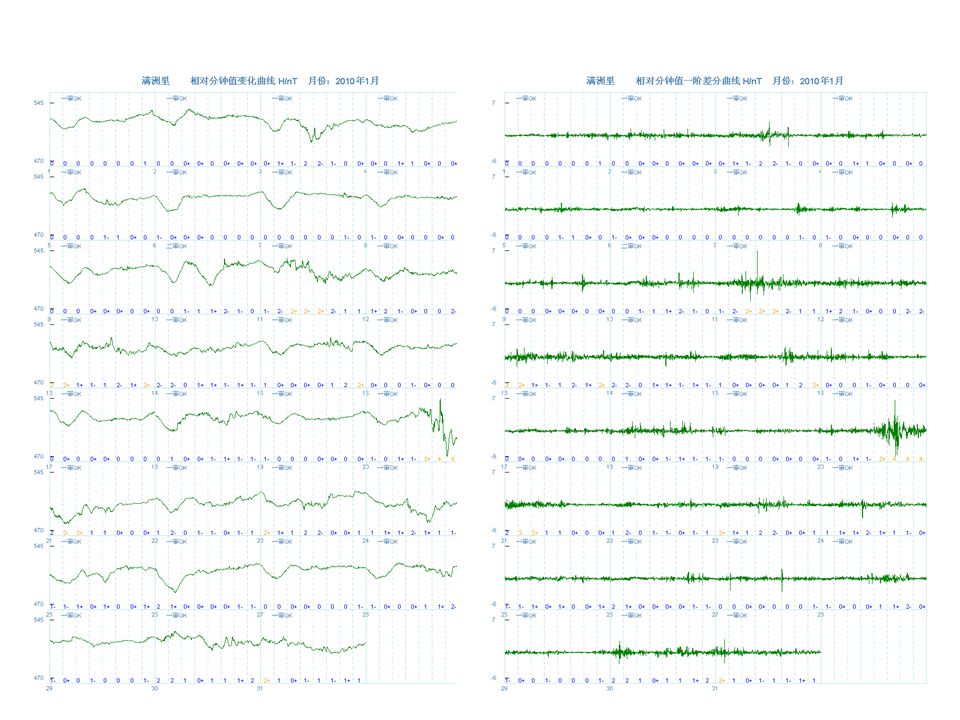
The disturbances revealed by the first differences could be seen in all the observatories simultaneously which reminded us that the source for the disturbances was in the magnetosphere.

6
The first differences also showed 27 solar-cycle recurrences. The feature was quite similar with the Kp’s.

8
There are some disturbances that Kp could not describe. Another new index might be needed for people to understand the change of the magnetic field.

9
Outline Introduction Data Processing Results and Discussion Conclusion

10
Data Minute data for the year 2008 from the following observatories –Chinese observatories –Global observatories CLF, MMB, HON and SJG Data downloaded from INTERMAGNET website

11
Method Vr index calculation: –Calculating the first differences of the minute values of the geomagnetic horizontal component (H D/X Y). –calculating the hourly standard deviations of the above first differences. –Subtracting background noises (0.1nT) from the hourly standard deviations –In case that the hourly standard deviation was less than 0.1nT, the Vr value was assigned to be 0.
 from the hourly standard deviations –In case that the hourly standard deviation was less than 0.1nT, the Vr value was assigned to be 0..")
12
Noise level of 1s data Noise Level achieved –D 0.06nT –H 0.07nT –Z 0.07nT –F 0.04nT

13
Outline Introduction Data Processing Results and Discussion Conclusion

14
Results and Discussion Relationship between Vr and other indices Temporal Change of Vr –Changes with the 27 solar rotation cycle –Seasonal change Spatial change of Vr –Latitudinal dependences (not talked today) –Longitudinal dependences (Local time dependences)
 –Longitudinal dependences (Local time dependences)")
15
SJGMMBCLFHONWMQ KP 0.774620.7579630.7674820.7511120.745843 AP 0.7688730.7170890.7456540.7231170.716811 Correlation between Vr and other indices

17
The first differences also showed 27 solar-cycle recurrences. The feature was quite similar with the Kp’s.

18
Monthly Means for H/X Component

19
Monthly Means for D/Y Component

20
Local time dependence of Vr

21
Observatories used in the study IAGA code Latitude (°) Longitude (°) Local time differences referred to UTC CLF48.022.270 WMQ43.8087.706h MMB43.91144.1910h HON21.32202.0013h SJG18.12293.8520h
 Longitude (°) Local time differences referred to UTC CLF WMQ h MMB h HON h SJG h")
22
Annual Means

23
H/X component D/Y component

26
Outline Introduction Data Processing Results and Discussion Conclusion

27
Vr is an index that can be used to detect geomagnetic disturbances from the magnetosphere. Vr has clear physical meaning. Vr can detect geomagnetic disturbances not only those Kp and ap detect but also some small disturbances that Kp and ap can not detect. So Vr is more sensitive to the geomagnetic activities than Kp and ap. Vr can be easily calculated by individual observatory so it can be used as a regional index and can serve people in quasi real time.

28
END Thanks for your attention

Similar presentations


, Ian G. Richardson (GSFC), David S. Evans.>")


 Saint Petersburg.>")
