Download presentation
Presentation is loading. Please wait.

1
Export and Rail Freight Trends at the U.S.-Canadian Border Chris Dingman Northern Border Transportation Specialist United States Department of Transportation Federal Highway Administration Border to Border Transportation Conference McAllen, Texas November 18-20, 2014

2
Presentation Outline Detail important data and trends related to trade, exports and freight movements at the border of the United States and Canada. Discuss rail freight volumes in the United States, looking at historical data, current levels, and future projections. Examine rail freight trends among the Top 10 highest volume (in US$) Northern border crossings focusing in particular on two groups: the Largest 3 and Next 7.
 Northern border crossings focusing in particular on two groups: the Largest 3 and Next 7..")
3
United States/Canada Trade and Export Trends

4
Why Focus on Trade and the United States/Canada Relationship? Looking at all modes of transportation, $632 billion of trade crossed the US/Canadian border in 2013. How much is that? $52.7 Billion per month $1.7 Billion per day $72.1 Million per hour $1.2 Million per minute $20,000 per second Source: Bureau of Transportation Statistics-North American Transborder Freight Data

5
US/Canadian Export Facts Canada is the United States’ largest export partner. In 2013, US exports to Canada represented 19% of all US exports. Almost 1 dollar of every 5 that the US exports goes to our neighbors to the north. US exports to Canada are up 77% since 2003 and 319% since 1993. Source: Office of the United States Trade Representative

6
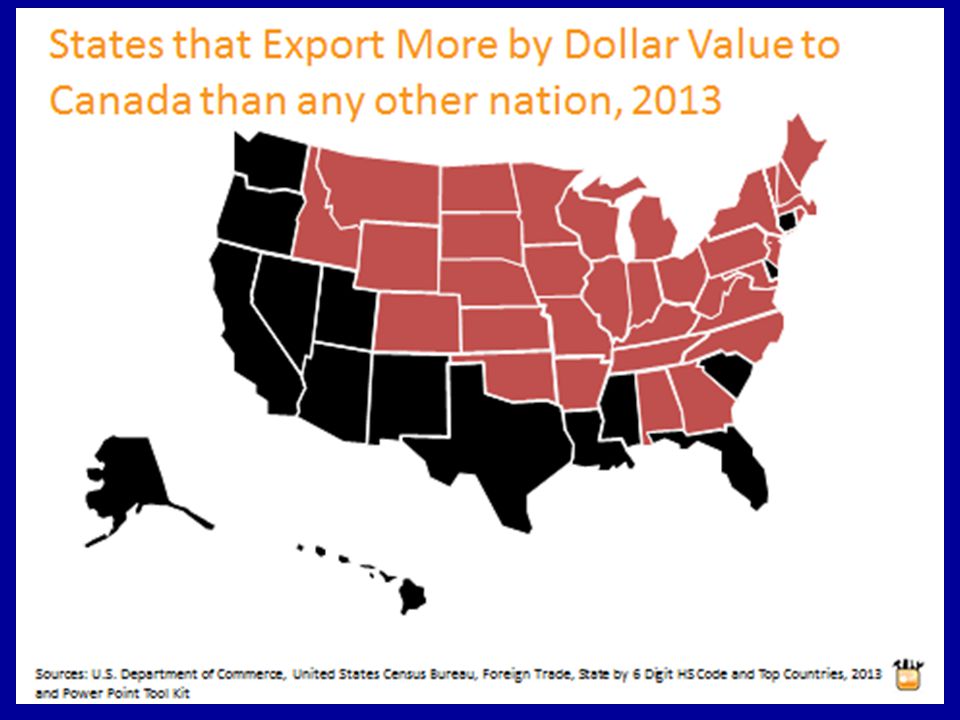
More Facts about US/Canadian Exports In 2013, the U.S. exported more (in US $ value) to Canada than to China, Germany, Japan and the United Kingdom combined. Number of U.S. States that count Canada as their largest export market? 34 Sources: United States Department of Commerce/Census Bureau
 to Canada than to China, Germany, Japan and the United Kingdom combined. Number of U.S. States that count Canada as their largest export market. 34 Sources: United States Department of Commerce/Census Bureau.")
8
Rail Freight Trends United States

9
Image created by Federal Railroad Administration, Office of Railroad Policy and Development (Office of Policy), based on Surface Transportation Board’s 2010 Carload Waybill Sample.
, based on Surface Transportation Board’s 2010 Carload Waybill Sample.")
12
U.S. Nationwide Rail Freight Trends 2011 actual U.S. rail shipment volumes were 1.895 billion tons. 2040 projected U.S. rail shipment volumes are 2.770 billion tons. That’s a projected 31.6% increase or about 875 million tons. Approximately 1.1% increase annually. Sources: Federal Highway Administration, Freight Analysis Framework, 2012 and FHWA-Freight Facts and Figures 2012

15
Rail Freight Trends Selected Crossings Source of all data in this section: Bureau of Transportation Statistics-North American Transborder Freight Data Base Maps Source: ESRI

16
Largest 3 and Next 7 The three highest volume (US$) Northern Border Rail Freight crossings in 2000 are: –Detroit, MI/Windsor, ON –Buffalo-Niagara Falls, NY/Fort Erie-Niagara Falls, ON –Port Huron, MI/Sarnia, ON The next seven highest volume crossings (US$) are: –International Falls, MN/Fort Frances, ON –Portal, ND/North Portal, SK –Blaine, WA/Douglas, BC –Champlain-Rouses Point, NY/Lacolle, QC –Pembina, ND/Emerson, MB –Eastport, ID/Kingsgate, BC –Sweetgrass, MT/Coutts, AB
 Northern Border Rail Freight crossings in 2000 are: –Detroit, MI/Windsor, ON –Buffalo-Niagara Falls, NY/Fort Erie-Niagara Falls, ON –Port Huron, MI/Sarnia, ON The next seven highest volume crossings (US$) are: –International Falls, MN/Fort Frances, ON –Portal, ND/North Portal, SK –Blaine, WA/Douglas, BC –Champlain-Rouses Point, NY/Lacolle, QC –Pembina, ND/Emerson, MB –Eastport, ID/Kingsgate, BC –Sweetgrass, MT/Coutts, AB")
17
Largest 3 Rail Crossings Port Huron Detroit Buffalo

18
Next 7 Rail Crossings Blaine Eastport Sweetgrass PortalPembina International Falls Champlain

19
Total Rail Freight Volume of Top 10 Northern Border Crossings 2000 (US $) Port of Entry2000 (US $) Port Huron, Michigan24,644,470,999 Buffalo-Niagara Falls, New York14,473,455,388 Detroit, Michigan8,597,407,366 International Falls-Rainer, Minnesota3,956,966,907 Portal, North Dakota2,192,704,416 Blaine, Washington1,535,733,856 Champlain-Rouses Point, New York1,041,239,819 Eastport, Idaho907,007,605 Sweetgrass, Montana470,191,808 Pembina, North Dakota180,198,598
 Port of Entry2000 (US $) Port Huron, Michigan24,644,470,999 Buffalo-Niagara Falls, New York14,473,455,388 Detroit, Michigan8,597,407,366 International Falls-Rainer, Minnesota3,956,966,907 Portal, North Dakota2,192,704,416 Blaine, Washington1,535,733,856 Champlain-Rouses Point, New York1,041,239,819 Eastport, Idaho907,007,605 Sweetgrass, Montana470,191,808 Pembina, North Dakota180,198,598")
20
Total Rail Freight Volume of Top 10 Northern Border Crossings 2010 (US $) Port of Entry2010 (US $) Port Huron, Michigan23,402,608,867 Detroit, Michigan19,085,885,262 Buffalo-Niagara Falls, New York10,061,096,434 International Falls-Rainer, Minnesota7,743,119,760 Portal, North Dakota6,872,212,311 Pembina, North Dakota3,018,330,147 Blaine, Washington2,864,649,358 Champlain-Rouses Point, New York2,752,822,682 Eastport, Idaho2,237,631,159 Sweetgrass, Montana1,295,953,855
 Port of Entry2010 (US $) Port Huron, Michigan23,402,608,867 Detroit, Michigan19,085,885,262 Buffalo-Niagara Falls, New York10,061,096,434 International Falls-Rainer, Minnesota7,743,119,760 Portal, North Dakota6,872,212,311 Pembina, North Dakota3,018,330,147 Blaine, Washington2,864,649,358 Champlain-Rouses Point, New York2,752,822,682 Eastport, Idaho2,237,631,159 Sweetgrass, Montana1,295,953,855")
21
Total Rail Freight Volume of Top 10 Northern Border Crossings 2013 (US $) Port of Entry2013 (US $) Port Huron, Michigan26,865,671,644 Detroit, Michigan23,890,309,725 International Falls-Rainer, Minnesota13,352,417,024 Buffalo-Niagara Falls, New York11,280,033,249 Portal, North Dakota8,437,701,876 Pembina, North Dakota5,208,125,207 Blaine, Washington4,090,746,412 Champlain-Rouses Point, New York2,881,567,070 Eastport, Idaho2,646,347,296 Sweetgrass, Montana1,889,367,496
 Port of Entry2013 (US $) Port Huron, Michigan26,865,671,644 Detroit, Michigan23,890,309,725 International Falls-Rainer, Minnesota13,352,417,024 Buffalo-Niagara Falls, New York11,280,033,249 Portal, North Dakota8,437,701,876 Pembina, North Dakota5,208,125,207 Blaine, Washington4,090,746,412 Champlain-Rouses Point, New York2,881,567,070 Eastport, Idaho2,646,347,296 Sweetgrass, Montana1,889,367,496")
22
Top 10 Rail Freight Volume Growth (in US$) by Percentage 2000-2013 Port of Entry2000-2013 Growth Port Huron, Michigan 9.0% Detroit, Michigan 177.9% Buffalo-Niagara Falls, New York -30.5% International Falls-Rainer, Minnesota 237.4% Portal, North Dakota 284.8% Pembina, North Dakota 2790.2% Blaine, Washington 166.3% Champlain-Rouses Point, New York 176.7% Eastport, Idaho 191.7% Sweetgrass, Montana 301.8% Detroit: 2000-2007: 149.1% 2007-2013: 11.5%
 by Percentage Port of Entry Growth Port Huron, Michigan 9.0% Detroit, Michigan 177.9% Buffalo-Niagara Falls, New York -30.5% International Falls-Rainer, Minnesota 237.4% Portal, North Dakota 284.8% Pembina, North Dakota % Blaine, Washington 166.3% Champlain-Rouses Point, New York 176.7% Eastport, Idaho 191.7% Sweetgrass, Montana 301.8% Detroit: : 149.1% : 11.5%")
23
Percentage of 3 Largest Freight Rail Crossings and Next 7 Crossings Total Volume of All US/Canada Border Rail Freight Traffic in US$ for 2000 and 2013 2000 2013

24
Summary U.S. exports with Canada are more robust than most people think and trending upward. Rail freight volumes have not quite rebounded to pre-Recession levels but are projected to grow significantly in the United States over the next 25-30 years. Recent trends show rail freight volumes spreading out along the entire Northern Border rather than being focused in a more regional geographic area.

25
Thank you! Christopher Dingman Northern Border Transportation Specialist FHWA-Michigan Division (517) 702-1830 christopher.dingman@dot.gov
")
Similar presentations


 1.>")


, Washington State Legislative Board (WSLB) February 2014.>")


