Download presentation
Presentation is loading. Please wait.

1
Mapping Evapotranspiration with Satellite Products NASA Remote Sensing Training Norman, Oklahoma, June 19-20, 2012 Presented by Cindy Schmidt (ARSET) with contributions from David Toll and Rick Allen A RSET Applied Remote SEnsing Training A project of NASA Applied Sciences
 with contributions from David Toll and Rick Allen A RSET Applied Remote SEnsing Training A project of NASA Applied Sciences")
2
Overview Benefits and opportunities of using remote sensing for ET Methods of deriving ET using remote sensing: - Challenges - Applications of ET - Web based tools for accessing ET. Conclusions

3
Consumptive Water Loss Through Evapotranspiration Hydrological information on irrigation efficiency and water withdrawals from evapotranspiration are difficult to measure and hard to obtain. Evapotranspiration (water loss) from the land surface is spatially complex and is conducive for estimation using remote sensing. IPCC Source: David Toll, NASA Goddard Space Flight Center
 from the land surface is spatially complex and is conducive for estimation using remote sensing. IPCC Source: David Toll, NASA Goddard Space Flight Center.")
4
Observational ET Challenges: In-situ measurements: Closure of the water balance at Flux towers is a significant problem. In-situ FLUXNET measurements are Not uniformly distributed around the Globe. Remote Sensing: -High resolution data are needed to develop information for agricultural applications. -Thermal IR sensor data are needed on an on-going basis. Disruptions in input data affect the quality of the product Source: Rick Allen, University of Idaho

5
Opportunities for Mapping ET Using Remote Sensing Strong interest in consumption-based estimates of the water balance. ET can be a core product for water management applications. Contribute to informed discussion of transboundary water issues. Remote sensing is becoming a viable option for mapping ET with several techniques and new data bases. Need for improving in situ measurement and remote sensing validation. Source: David Toll, NASA Goddard Space Flight Center

6
Drought Index of Actual ET/Pot’l ET (2007-2010) Anderson/USDA NileDelta Sudd Wetland Remote Sensing Products and tools for Measuring Consumptive Water Loss and Evapotranspiration Remote sensing of ET primarily from using satellite infrared data - Meteosat (~10 km) - MODIS (~1 km) - Landsat (~100 m) Several ET remote sensing algorithms - ‘ALEXI’ (Two Source) - ‘SEBAL/METRIC’ - ‘SEBI/SEBS’ Additional satellite ET remote sensing capabilities from SMAP, VIIRS & GRACE When normalized with ‘Potential ET’ provides index of drought When combined with modeling (e.g., ‘LDAS’) tools may provide predictions. Source: David Toll, NASA Goddard Space Flight Center

7
Remotely Sensed ET may be used to improve modeling Source: David Toll, NASA Goddard Space Flight Center

8
Examples of satellite derived ET products (not a comprehensive list) MODIS (MOD16, Global) – lower spatial resolution Landsat High Resolution and Interrelated Calibration (SEBAL/METRIC) (Regional/Local) – higher spatial resolution ET products via the Satellite Irrigation Management Support (SIMS) (Regional/Local to California) – higher spatial resolution
 MODIS (MOD16, Global) – lower spatial resolution Landsat High Resolution and Interrelated Calibration (SEBAL/METRIC) (Regional/Local) – higher spatial resolution ET products via the Satellite Irrigation Management Support (SIMS) (Regional/Local to California) – higher spatial resolution")
9
MODIS Based Global Evapotranspiration and Drought Severity Index Products Developed by Qiaozhen Mu, Maosheng Zhao, and Steven W. Running Numerical Terradynamic Simulation Group, College of Forestry and Conservation, The University of Montana Missoula Product name: MOD16http://www.ntsg.umt.edu/project/mod16http://www.ntsg.umt.edu/project/mod16

10
Source: Qiaozhen Mu, University of Montana

11
Global annual 1-km ET over 2000-2010 The Global average MODIS ET over vegetated land surface is 575.9 ± 381.6 mm yr -1. Source: Qiaozhen Mu, University of Montana

12
High Resolution Satellite-based ET: SEBAL and METRIC SEBAL – Bastiaanssen, WaterWatch –Used world-wide –Applications: ET and crop productivity METRIC –Univ. Idaho / Idaho Dept. Water Resources –Univ. Nebraska / DNR –New Mexico Tech. –Montana DNRC –Nevada DRI / NOSE –Colorado NCWCD / Riverside Tech. –World Bank - Morocco Source: Rick Allen, University of Idaho

13
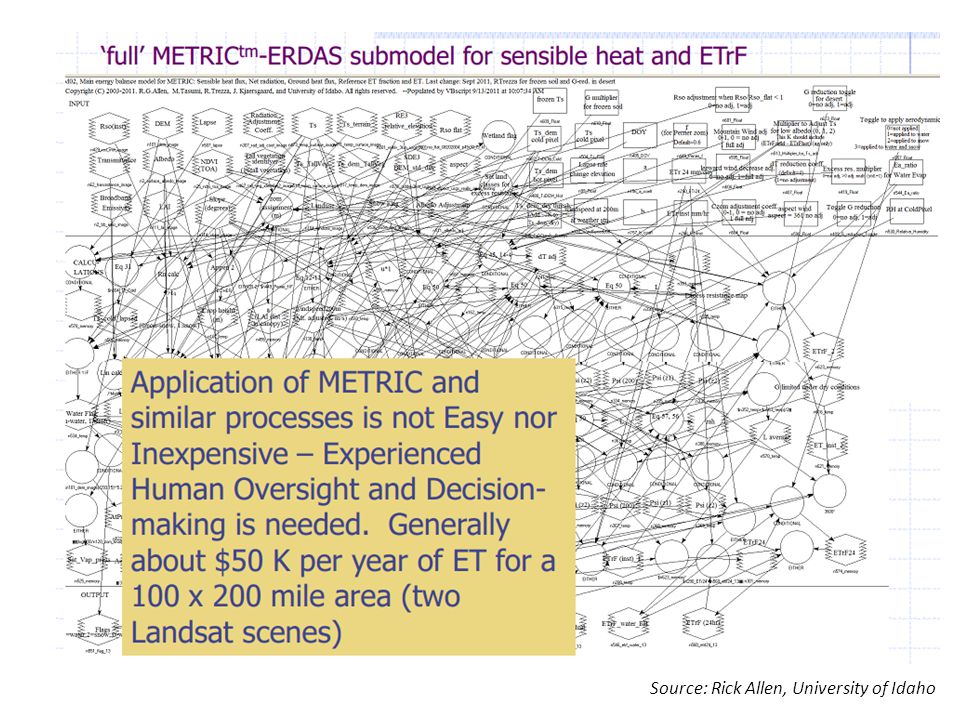
Mapping EvapoTranspiration with high Resolution and Internalized Calibration (METRIC tm ) Rooted in the Dutch SEBAL 2000 algorithms by Bastiaanssen. METRIC tm and SEBAL are, in general, complementary processes Developed by Allen, Tasumi and Trezza, University of Idaho, Kimberly Landsat based algorithm Began in 2000 Primary applications: Irrigated Agriculture Riparian Vegetation Desert Systems Wetlands Source: Rick Allen, University of Idaho

14
ET is calculated as a “residual” of the energy balance ET = R - G - H n Basic Truth: Evaporation consumes Energy Why Energy balance? R n G (heat to ground) H (heat to air) ET (radiation from sun and sky) Source: Rick Allen, University of Idaho
 H (heat to air) ET (radiation from sun and sky) Source: Rick Allen, University of Idaho.")
15
We can ‘see’ impacts on ET caused by: water shortage disease crop variety planting density cropping dates salinity management oEnergy balance requires THERMAL information oMany of these effects can be ‘missed’ by vegetation index based methods oET reduction effects can be converted directly into an evapotranspiration coefficient Energy balance gives us “actual” ET Source: Rick Allen, University of Idaho

16
KcKc 0.00 0.3 0.6 0.9 1.2 1.4 METRIC application in La Mancha, Spain, 2003 Why use High Resolution Imagery? ET from individual Fields is Critical for: Water Rights, Water Transfers, Farm Water Management (K c based on ET o ) Source: Rick Allen, University of Idaho
 Source: Rick Allen, University of Idaho.")
17
Landsat 5 -- Albacete, Spain, 07/15/2003 ET ratio before sharpeningET ratio after sharpening Sharpening of Thermal Band of Landsat 5 from 120 m to 30 m using NDVI Source: Rick Allen, University of Idaho

18
Landsat False Color (MRG) 8/26/2002 10:33am MODIS False Color (MRG) 8/26/2002 11:02am Landsat vs MODIS Why use High Resolution Imagery? Source: Rick Allen, University of Idaho

19
Why use High Resolution Imagery? Landsat 7 MODIS -same day, large scan angle MODIS –near nadir scan angle ET of Idaho by AVHRR- ALEXI (Anderson et al.) Source: Rick Allen, University of Idaho
 Source: Rick Allen, University of Idaho.")
20
12/17/01 Comparison of Metric and Lysimeter Measurements: Lysimeter at Kimberly (Wright) 1968-1991 Source: Rick Allen, University of Idaho
 Source: Rick Allen, University of Idaho")
21
METRIC Lysimeter 718 mm METRIC 714 mm Sugar Beets Comparison of Seasonal ET by METRIC tm with Lysimeter Measurements ET (mm) - April-Sept., Kimberly, 1989 Source: Rick Allen, University of Idaho
 - April-Sept., Kimberly, 1989 Source: Rick Allen, University of Idaho")
22
METRIC ET Applications at the Idaho Department of Water Resources 1.Aquifer depletion 2.Water rights buy-back 3.Planning: ET by land use class 4.Water use by irrigated agriculture 5.Water rights compliance monitoring 6.Modeling: ET for computing water budgets 7.Analysis of water-rights curtailment alternatives. Source: Rick Allen, University of Idaho

23
Metric: Agricultural Water Use Source: Rick Allen, University of Idaho

24
Metric: Agricultural Water Use Year Water Use in Acre Feet Irrigated Hectares Mean Water Use in Millimeters Source 2000 9,313,505 1,437,520 790 - 1021 Alfalfa (.77) IDWR/METRIC 2002 -- 1,176,516 -- Census of Agriculture 2000 -- 1,367,859 -- USGS 1997 -- 1,241,522 -- Census of Agriculture 1995 4,396,707 1,097,225 490 (807 Alfalfa) (.61) USGS 1992 -- 1,169,710 -- Census of Agriculture 1990 6,817,991 1,235,348 670 (957 Alfalfa) (.70) USGS/IDWR 1987 -- 1,146,018 -- Census of Agriculture RESULTS Source: Rick Allen, University of Idaho
 IDWR/METRIC ,176, Census of Agriculture ,367, USGS ,241, Census of Agriculture ,396,707 1,097, (807 Alfalfa) (.61) USGS ,169, Census of Agriculture ,817,991 1,235, (957 Alfalfa) (.70) USGS/IDWR ,146, Census of Agriculture RESULTS Source: Rick Allen, University of Idaho")
25
ET from Metric: Summary ET maps are valuable for: Determining Actual ET Water Transfers Water Rights Conflicts Diversion Management for Endangered Species Ground-water Management Consumption by Riparian Vegetation ET maps by METRIC tm (and SEBAL) have good accuracy and consistency A single, high resolution thermal band is adequate and essential Source: Rick Allen, University of Idaho
 have good accuracy and consistency A single, high resolution thermal band is adequate and essential Source: Rick Allen, University of Idaho")
27
Metric: Additional Information www.kimberly.uidaho.edu/water/www.kimberly.uidaho.edu/water/ (METRIC tm ) http://www.idwr.idaho.gov/gisdata/et.htm http://maps.idwr.idaho.gov/et/ Source: Rick Allen, University of Idaho
 Source: Rick Allen, University of Idaho")
28
Source: Forrest Melton, CSUMB/NASA Satellite Irrigation Management Support (SIMS) with the NASA Terrestrial Observation and Prediction System (TOPS) TOPS provides multi satellite based ecological nowcast and forecast
 with the NASA Terrestrial Observation and Prediction System (TOPS) TOPS provides multi satellite based ecological nowcast and forecast")
29
Nemani et al., 2003, 2007, 2008 TOPS: Common Modeling Framework Monitoring, modeling, & forecasting at multiple scales

30
Source: Forrest Melton, CSUMB/NASA Mapping Crop Coefficients from Satellite Data

31
Source: Forrest Melton, CSUMB/NASA Integration of Satellite and Surface Observations Networks to estimate ET

32
Source: Forrest Melton, CSUMB/NASA ET Information Product Requirements

33
Access to TOPS TOPS website http://ecocast.arc.nasa.gov/sims/ TOPS website for data access (beta) http://www.ecocast.org/dgw/sims
")
34
Source: Forrest Melton, CSUMB/NASA

35
Summary: TOPS-SIMS

36
Conclusions Deriving ET is a complex process. ET is not directly measured. There are multiple ET products available that utilize different approaches and remote sensing instruments. High resolution thermal imaging is critical

Similar presentations


>")


