Download presentation
Presentation is loading. Please wait.

1
Understanding our First Years Three studies and a comparison

2
Understanding our First Years Karen Brodsky, Instruction and Outreach Coordinator, Sonoma State University Linda J. Goff, Head of Instructional Services, California State University, Sacramento Gabriela Sonntag, Coordinator, Information Literacy Program, California State University, San Marcos Sharon Hamill, Professor of Psychology, California State University, San Marcos CARL Conference, Friday April 4, 2008, Irvine CA

3
Agenda – Part One Overview -handouts Definition of iSkills Demographics Similarities and Differences in campus projects

4
Our Three Projects - Similarities Focused on Entering Freshman Each a 2 year project Common Goal – establish baseline under- standing of first-year students’ knowledge of information competence/literacy Used iSkills as pre and post test

5
Sacramento - Differences 132 F’06 & 107in F’07 (239) did both pre & post test Faculty groups worked on InfoLit lesson plans Intervention lesson was one class session Student incentive of $50 gift certificate Testing at Sacramento
 did both pre & post test Faculty groups worked on InfoLit lesson plans Intervention lesson was one class session Student incentive of $50 gift certificate Testing at Sacramento")
6
San Marcos - Differences Freshman Seminars and Oral Communication 3 weeks IL vs. 1 hour IL Institutional data gathered included analysis of retention factors

7
Sonoma - Differences Year-long class over 2 pilot years (A2, A3) ~ 8 sessions per class over the year Librarians integral in curriculum development Faculty Development Instruction at Sonoma
 ~ 8 sessions per class over the year Librarians integral in curriculum development Faculty Development Instruction at Sonoma")
8
Agenda – Part Two Data review Test scores ETS reports

9
Sacramento Pre/Post-test Scores Fall2006Fall2007

10
Sacramento Scores 2006 Aggregate ETS reports indicate strongest need for instruction in skill areas: Evaluate, Create and Communicate 2007 scores included Honors classes 2007 Aggregate ETS reports therefore slightly higher

11
Honors Sac - Comparison of Average Scores EOP – Honors- GE classes

12
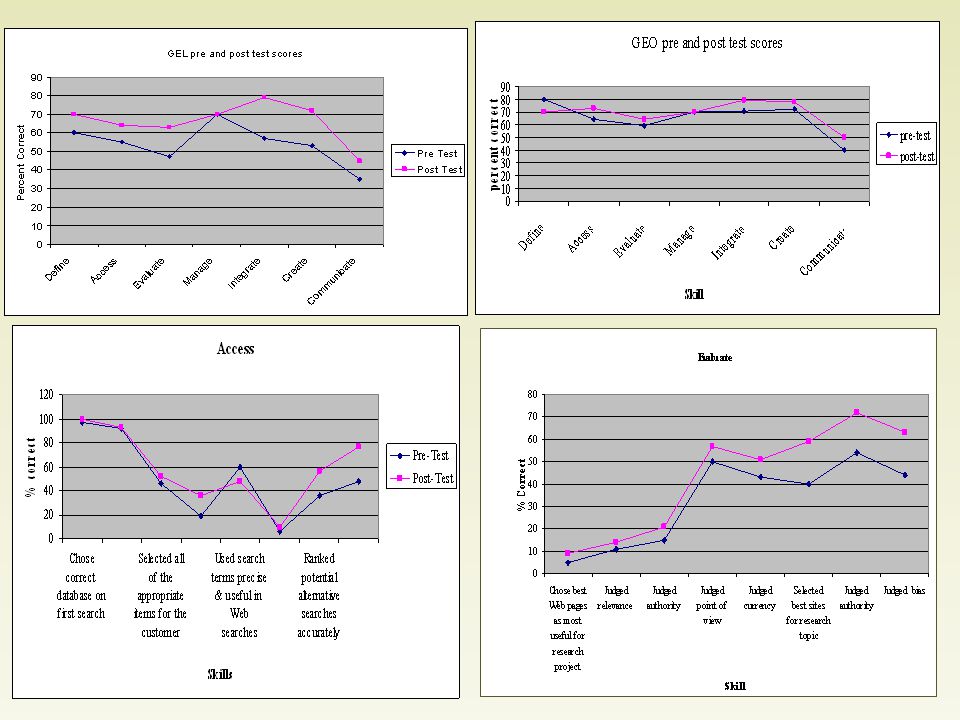
San Marcos Pre/Post-test Scores GEL(2006)GEO (2006)
GEO (2006)")
13
San Marcos Scores Lesson plans were not matched to test content All students show considerable improvement. GEO students outperformed GEL Students not needing remediation take GEO in Fall

15
Comparing GEL and non-GEL Fall 2000 EntrantsFall 2001 EntrantsFall 2002 EntrantsFall 2003 EntrantsFall 2004 Entrants Percent Number Percent Number Percent Number Percent Number Percent Number Cumulative GPA All GEL 101 Students 2.73 (305) 2.70 (307) 2.59 (487) 2.66 (486) 2.73 (344) Non-GEL 101 2.75 (204) 3.14 (176) 2.73 (258) 2.73 (331) 2.73 (317) One Year Continuation Rates All GEL 101 Students 72.0 (321) 69.7 (323) 76.7 (520) 76.2 (509) 71.9 (358) All Freshmen* 60.0 (575) 62.0 (545) 70.7 (837) 71.0 (890) 69.5 (722) Two Year Continuation Rates All GEL 101 Students 65.1 (321) 59.8 (323) 63.5 (520) 66.2 (509)n/a All Freshmen* 51.3 (575) 52.7 (545) 58.4 (837) 60.6 (890)n/a
 2.70 (307) 2.59 (487) 2.66 (486) 2.73 (344) Non-GEL (204) 3.14 (176) 2.73 (258) 2.73 (331) 2.73 (317) One Year Continuation Rates All GEL 101 Students 72.0 (321) 69.7 (323) 76.7 (520) 76.2 (509) 71.9 (358) All Freshmen* 60.0 (575) 62.0 (545) 70.7 (837) 71.0 (890) 69.5 (722) Two Year Continuation Rates All GEL 101 Students 65.1 (321) 59.8 (323) 63.5 (520) 66.2 (509)n/a All Freshmen* 51.3 (575) 52.7 (545) 58.4 (837) 60.6 (890)n/a")
16
Pre - Fall 2006 103 participants (68%) Scheduled outside class Required for “participation points” Slightly above average – except for “Define” Post - Spring 2007 44 students participated –33 students repeat Results not statistically relevant Scheduled out class Required for “participation points” Sonoma Year Fall 2006 pre/post test
 Scheduled outside class Required for participation points Slightly above average – except for Define Post - Spring students participated –33 students repeat Results not statistically relevant Scheduled out class Required for participation points Sonoma Year Fall 2006 pre/post test")
17
Sonoma – Year 2 pre/post test Fall 2007 144 participated (84%) Scheduled during Class Slightly above average - better on “Define” Spring 2008 No post-test
 Scheduled during Class Slightly above average - better on Define Spring 2008 No post-test")
18
Sonoma – pre-test comparison Fall 2006 –Slightly lower in “Define” –Slightly higher in “Access,” and “Create” Fall 2007 –Slightly higher in “Define” and “Integrate” Both groups equivalent for “Evaluate”

19
Agenda – Part Three Have you assessed first years? Have you used the i Skills test? What other instruments were used? What were your experiences?

20
Sacramento conclusions

21
iSkills is not based on ACRL-IL Lesson plan objectives based on ACRL Standards: (5.2.f- plagiarism) and (3.2.a evaluation of bias) Mismatch with iSkills test content – lessons and Standards
 and (3.2.a evaluation of bias) Mismatch with iSkills test content – lessons and Standards")
22
Problem with Data-driven Decisions Aggregate data available from ETS only for 100+ users Disconnect – class-level data not available for faculty Statistical significance vs. practical significance? One lesson intervention isn’t enough

23
Faculty Feedback “ETS needs to give us a results section that includes students weaknesses and strengths so that we can apply it to the development of lesson plans that will adequately address areas that need remediation.” RG, Sacramento

24
Outcomes (Sacramento) Freshman Programs Director and FS faculty have developed stronger working rapport with librarians and positive influence on information literacy program. Data useful for Freshman Program assessment and re-design

25
San Marcos Conclusions

26
One Year Analysis Sample as a whole scored higher on post-test. GEO students outperformed GEL students but most variance accounted for by the pre-test Only prior difference between groups was HS GPA (not EPT, ELM, or SAT) No difference in college GPA, units completed, units enrolled in or likelihood of enrolling
 No difference in college GPA, units completed, units enrolled in or likelihood of enrolling.")
27
Further Analysis GEL students more likely to –Go to the career center and math lab –Go see a professor during office hours and outside of class GEO students more likely to –Have a job No difference in going to the writing center, visiting with an academic advisor or going to the academic advising web page

28
Sonoma Conclusions

29
iSkills - What we learned SSU students scored near average or above in all categories Can’t assume entering classes will score the same Pre-test used to scaffold assignments, faculty training, etc. “Evaluation” was focus of several sessions Other assessment confirmed some of iSkills results – “Define”

30
iSkills - What else we learned iSkills could be one more indicator – must have multiple assessment tools Question of correlation of categories Pre/post test didn’t work for us Could be more useful tied to entire freshmen program -- not this particular class

31
Sonoma -- Outcomes Commitment to working with first year students. Fall planning... What do we really want our students to learn? What do we really want our faculty to learn?

32
Our Combined Conclusions

33
Overall Outcomes We have established a baseline measure of freshman ICT/iSkill, but not of InfoLit All 3 Libraries have developed stronger working relationships with Freshman Programs and grants have had positive influence on information literacy programs Data useful for Freshman Program assessment and re-design

34
Overall Conclusions Programmatic data not individual or by class Best used as a diagnostic Advanced iSkills test could be given to Major in upper division Faculty and students have greater awareness of Information Literacy Timing of testing critical Student motivation for assessment is lacking About iSkillsAbout First Years

35
Overall Conclusions More appropriate to test through Assessment Office or Testing Center Multiple measures are needed Recommitted to working with freshmen programs

36
Agenda – Part Four Next steps Your questions

37
Sacramento -- Next Steps Will add new First Year/Outreach Librarian position Will look at what worked at San Marcos and Sonoma IL programs Will invite other CSU’s to attend our Fall 2008 Freshman Seminar convocation, with sessions on FS/IL

38
San Marcos -- Next Steps Reviewing our homegrown Computer Competence Requirement exam Continue to analyze and review multiple sources of data Continue to revisit our curriculum for FY students throughout GE

39
Sonoma -- Next Steps FYE class approved by Academic Senate Developing online modules for basics iSkills won’t be administered through the library Continue integrating IL with freshmen curriculum across campus

40
Understanding our First Years Karen Brodsky, Instruction and Outreach Coordinator, Sonoma State University Linda J. Goff, Head of Instructional Services, California State University, Sacramento Gabriela Sonntag, Coordinator, Information Literacy Program, California State University, San Marcos Sharon Hamill, Professor of Psychology, California State University, San Marcos CARL Conference, Friday April 4, 2008, Irvine CA

Similar presentations


 Pamela E. Wanga, Ph.D. Associate.>")


