Download presentation
Presentation is loading. Please wait.

1
Voter Registration and Participation PAUL MITCHELL VICE PRESIDENT – POLITICAL DATA INC.

2
The 2014 Election Participation in the 2014 Elections was below all expectations ◦2014 Primary :: 25% Total Turnout – Gov Primary usually ~ 35% ◦2014 General :: 42% Total Turnout – Gov General usually ~ 52%

4
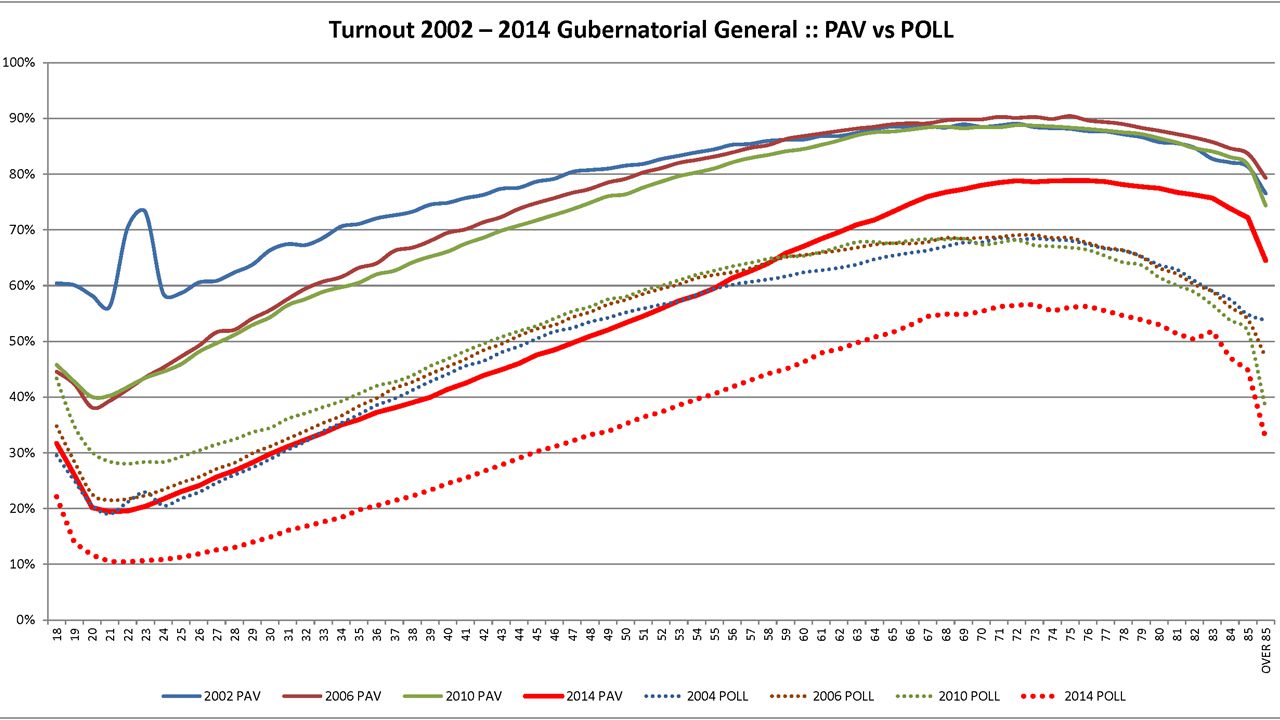
Age as a key factor in voting Who votes is very strongly associated with age ◦Looking at Registered Voters there is a strong historic pattern ◦High and low turnout elections generally follow same patterns ◦2014 showed strong drop for everyone under 60.

6
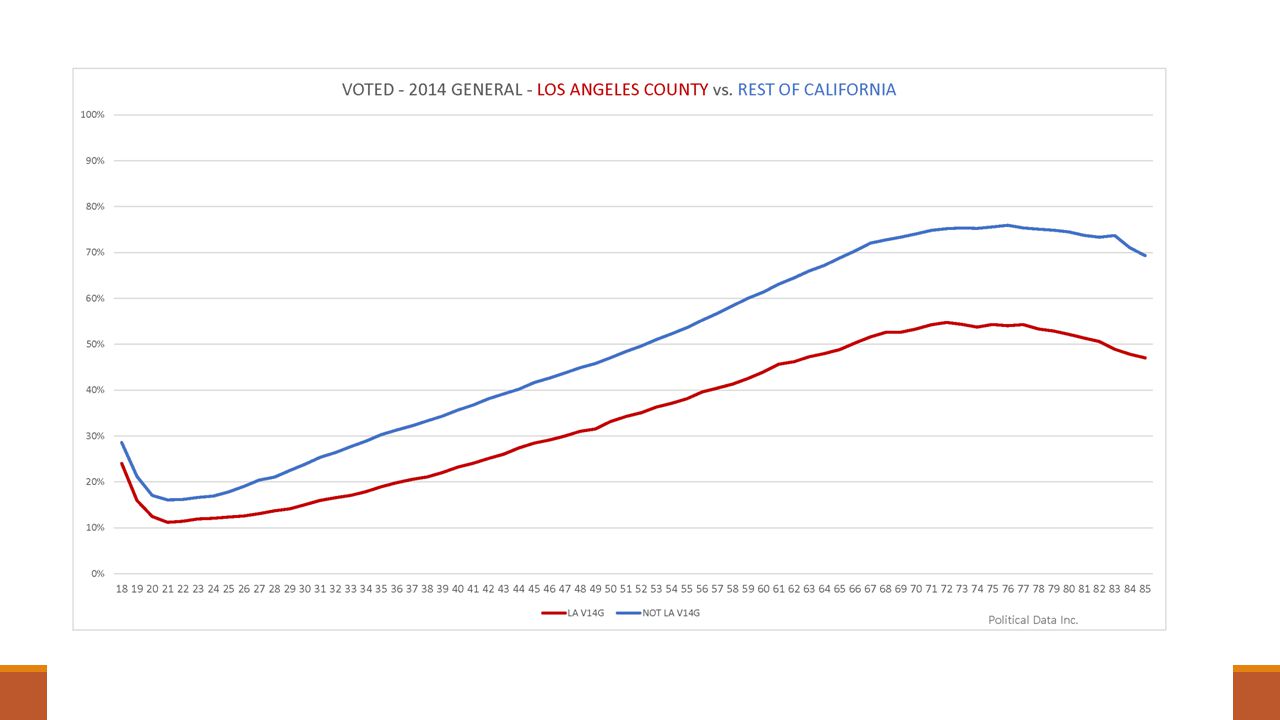
Los Angeles and Rest of State Different voting patterns historically ◦Significantly lower turnout 31% for LA / 46% for rest of state ◦Latino 23% to 31% Statewide; Asian 26% to 42% ◦Reduced vote turnout exists across age groups

8
Ethnicity and voting Hard to overstate the power of ethnicity in voting behavior ◦Dramatic differences between the population as a whole and those who vote – making for an Electorate that does not look like California. ◦Several Los Angeles Communities are Majority Latino but in low turnout elections the median voter is White ◦Latinos have only twice, in thousands of elections studied, significantly outpaced their rate of registration.

13
Absentee Voting Trends Rates of Permanent Absentee Status have been increasing. ◦2002 :: 9% of Voters are PAV :: 15% of Votes cast are By Mail ◦2014 :: 50% of Voters are PAV :: 62% of Votes cast are By Mail

14
Absentee Voting Trends Rates of Permanent Absentee Growth has been uneven. ◦LA County :: 31% of Voters are PAV // 44% of Votes cast are By Mail ◦SF Bay :: 60% of Voters are PAV // 69% of Votes cast are By Mail

15
Absentee Voting Trends Rates of Permanent Absentee Growth has been uneven. ◦Divergence in PAV use by Ethnicity :: African American 30% :: Latino 40% :: Asian 55% :: White 52%

16
Absentee Voting Trends Rates of Permanent Absentee Growth has been uneven. ◦New Registrants are becoming more PAV :: 49% of Traditional paper registration forms :: 60% of Motor Voter paper forms :: 66% of Online Voter Registrations

17
Absentee Voting Trends Rates of Permanent Absentee Growth has been uneven. ◦Age a significant factor, but Closing :: 2002: 25% of Age 60+ Ballots / 8% of Age 18-28 :: 2014: 68% of Age 60+ Ballots / 60% of Age 18-28

Similar presentations


. Part 1: The Right to Vote & Qualifications How have voting rights changed over time? What restrictions exist on.>")


