Download presentation
Presentation is loading. Please wait.

1
The Air Quality Learning and Demonstration Center at Penn State’s Teaching Module for Demonstrating Ozone Effects on Plants Presenter: Dennis R. Decoteau Depts. of Horticulture and Plant Pathology Penn State University

2
Importance Vegetation Injury Ozone pollution can cause a variety of injury on vegetation, including agricultural crops and commercial forestry species. Stipple Chlorotic mottle Reduced crop yields Premature defoliation Injury such as these can in turn affect the economy of the agricultural and commercial forestry sectors.

3
Graph demonstrating reduced crop yields due to ozone pollution. Source: Heck et al. Underside of leaf is clean Common milkweed showing stipple and demonstrating that it only occurs on the upper surface of the leaf Common milkweed showing stipple and demonstrating that it only occurs on the upper surface of the leaf.

4
The problems (or opportunities) Although ground level ozone is a major pollutant in many countries around the world, there are no existing educational modules to teach individuals about this important pollutant. Schools are typically not in session during the height of the ozone season (summer) it is difficult to show students the development of symptoms in real time.
 it is difficult to show students the development of symptoms in real time..")
5
Project Goal To develop a teaching module designed to effectively educate high school students and the general public about the effects of ground level ozone pollution on plant development.

6
Objectives Objective 1: To make connections between photographs of plant injury and corresponding ozone levels, recorded via weather data. Objective 2: To design a teaching module template that can be easily upgraded with the most current data sets of photographs and air pollution and weather data. Objective 3: To design and test a teaching module to be presented to groups of students. Objective 4: To upload the module onto a website for use by the general public and educators.

7
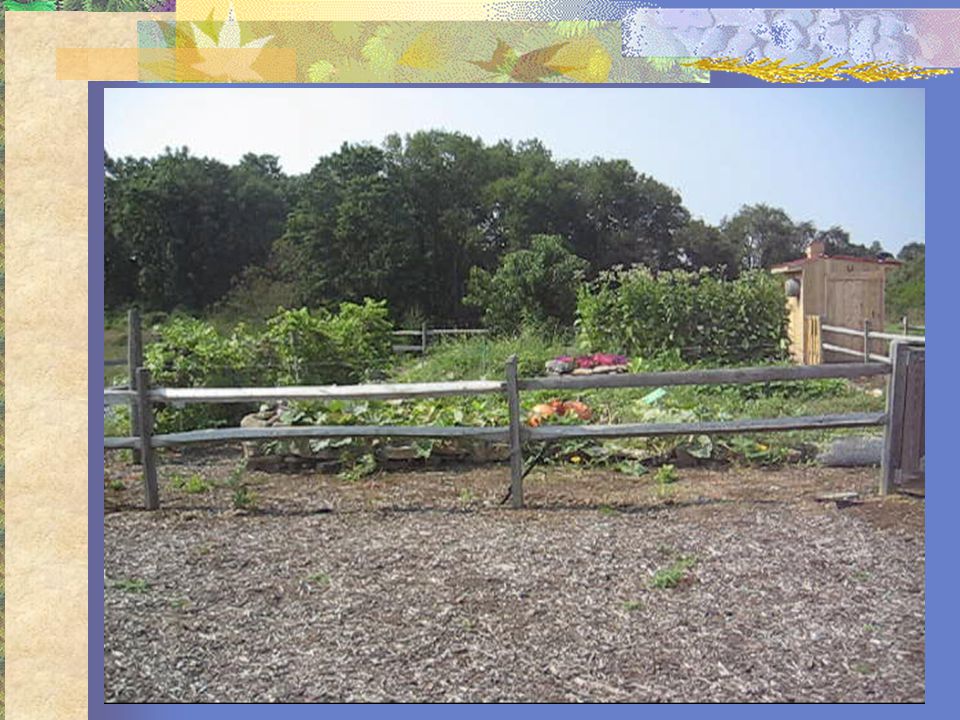
Research Facility: Air Quality Learning and Demonstration Center Location: The Arboretum at Penn State

8
Methodology Four Phases: Phase I: Collection and Analysis of Photographs, Weather and Air Pollution Data Phase II: Development of Teaching Module and Pre/Post- Module Quiz Phase III: Implementation of Teaching Module Phase IV: Post-Module Data Analysis

9
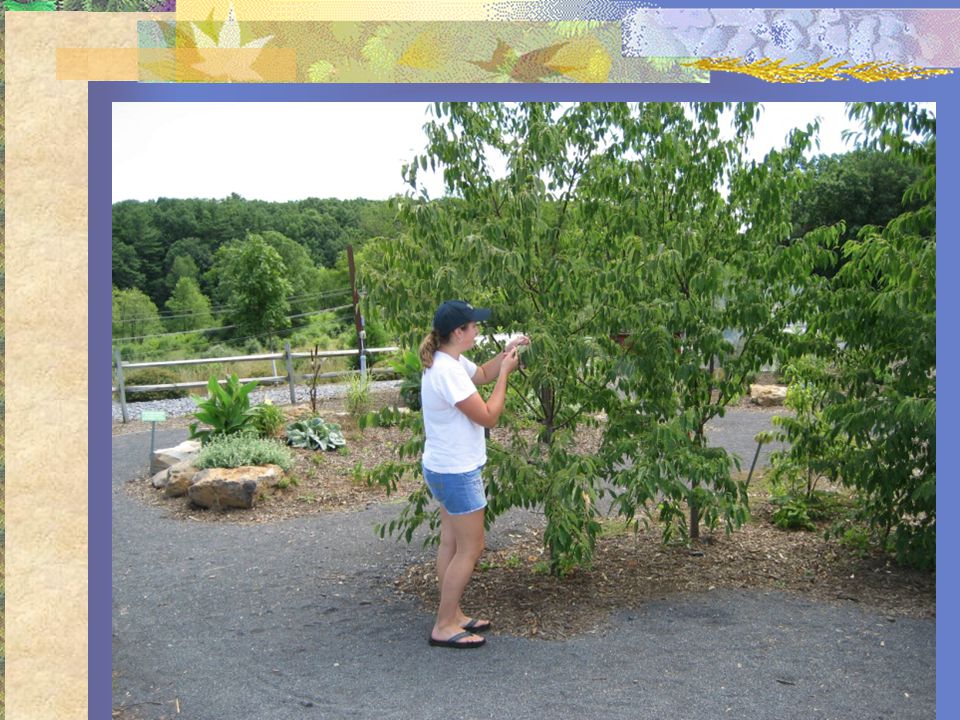
Phase I: Collection and Analysis of Photographs, Weather and Air Pollution Data When: PA Ozone Season mid-April through October Location: Air Quality Learning and Demonstration Center Photographed five ozone sensitive vegetation species for 15 weeks Purpose: To document ozone symptoms as they appeared on the vegetation and use the collected data in the learning module.

12
Vegetation Photographed: Agricultural Species Tobacco (Nicotiana tabacum) Chambourcin grapes (Vitis spp.)
 Chambourcin grapes (Vitis spp.)")
13
Vegetation Photographed: Non-Agricultural Species Black cherry (Prunus serotena) Common milkweed (Asclepias syriaca) Yellow poplar (Liriodendron tulipifera)
 Common milkweed (Asclepias syriaca) Yellow poplar (Liriodendron tulipifera)")
14
Photograph Results Two of the five species photographed at the Learning Center showed visible ozone injury Tobacco (Nicotiana tabacum) Chambourcin grapes (Vitis spp.) The three non-agricultural species showed no signs of ozone injury. Black cherry (Prunus serotena) Yellow poplar (Liriodendron tulipifera) Common milkweed (Asclepias syriaca)
 Yellow poplar (Liriodendron tulipifera) Common milkweed (Asclepias syriaca).")
15
Visible ozone induced stipple on Chambourcin Grape leaf. Ozone Injury

16
Visible ozone injury on tobacco

17
Ozone Injury Comparison between ozone resistant (left) and ozone sensitive (right) varieties of tobacco, planted within the agricultural garden at the Learning Center. Notice how the ozone resistant tobacco are much taller, fuller, and more vibrant than the ozone sensitive tobacco.

18
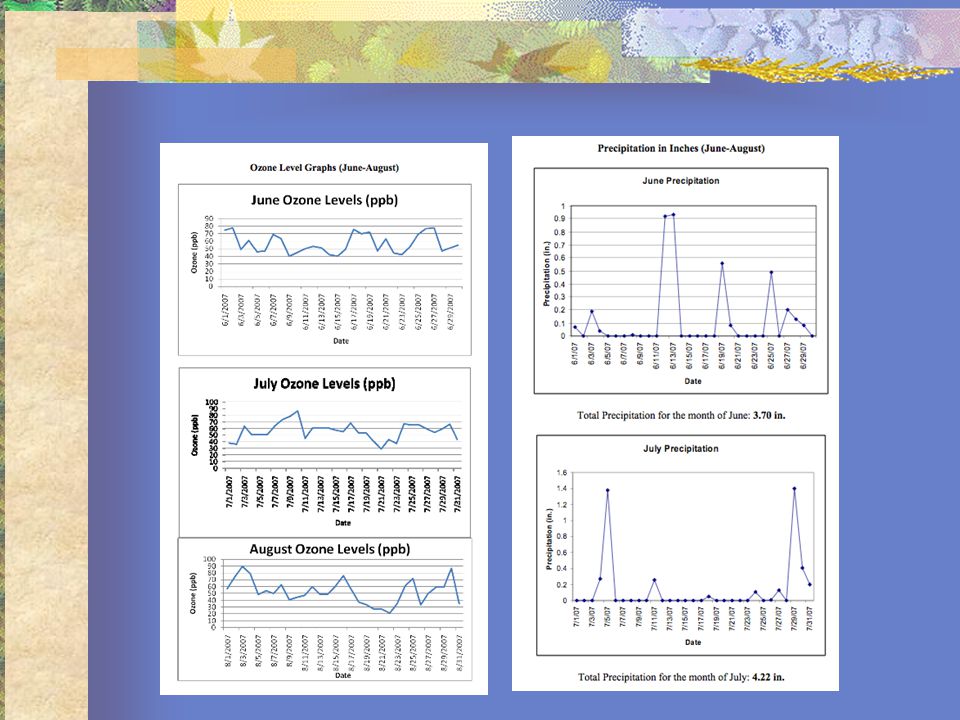
Monitoring for Air Pollutants Located at the Learning Center: PA Department of Environmental Protection (DEP), Bureau of Air Quality Monitoring Station Monitors and collects weather data and pollution levels including ozone.
, Bureau of Air Quality Monitoring Station Monitors and collects weather data and pollution levels including ozone.")
19
Phase II: Development of Teaching Module and Pre/Post-Module Quiz Developed teaching module using data and photographs collected in phase I as well as information from several other sources. Used Pennsylvania State Academic Standards as a guideline to assure that information covered was at appropriate grade level Helped fulfill standards for 7-12 grade Environment and Ecology: Environmental Health Environment and Ecology: Humans and the Environment

20
http://www.personal.psu.edu/drd10/Ozone_Learning_module/Ozone_Pollution_Teaching_ Module.html

21
Module Presentations and Topics Day 1- Ozone Pollution Introduction Topics: Air, Air Pollution, History of Air pollution, Air Pollution Regulations, Ozone, Costs of Air Pollution, Health Concerns, Environmental Concerns, Sources, Types, Transport, Ozone in PA Day 2 - Ozone Pollution Effects on Vegetation Topics: Plant processes (photosynthesis, respiration, transpiration), Environmental Factors, Monitoring, Plant Responses to Ozone and Injury, Effects on Crop Yields, Bioindicators, Plant/ozone Research and Benefits
, Environmental Factors, Monitoring, Plant Responses to Ozone and Injury, Effects on Crop Yields, Bioindicators, Plant/ozone Research and Benefits")
22
Environmental Crime Scene Investigations Activity

25
Ozone Homework

26
Phase III: Implementation of Teaching Module Gained permission to use human participants from the Office of Resource Protections (IRB# 26701) Presented module in Agricultural and Extension Education 313 course (AEE 313) Research Participants: Students of AEE 313, pre-service student teachers Pre/post module quiz was used to collect the data needed for testing the effectiveness of module
 Presented module in Agricultural and Extension Education 313 course (AEE 313) Research Participants: Students of AEE 313, pre-service student teachers Pre/post module quiz was used to collect the data needed for testing the effectiveness of module")
29
Phase IV: Post-Module Data Analysis Statistical Analysis: Paired t-test used to test the effectiveness of the teaching module Paired t-test Hypotheses: Null Hypothesis: The mean difference between the two quizzes will be equal to zero. H 0 : μ d = 0 Alternative Hypothesis: The mean difference between the two quizzes will not be equal to zero. Ha: μ d ≠ 0

30
Ozone Module Results The results of the paired t-test showed that the confidence interval {95% CI for mean difference: (-7.60444, -5.27056)} for the mean difference between the two quizzes did not include zero, which suggests a difference between them The small p-value (p=0.000) further suggests that the data are inconsistent with H 0 : μ d = 0, and that there is a difference between the two quizzes.
} for the mean difference between the two quizzes did not include zero, which suggests a difference between them The small p-value (p=0.000) further suggests that the data are inconsistent with H 0 : μ d = 0, and that there is a difference between the two quizzes.")
31
Ozone Module Results Participants did better on the post quiz (mean = 13.06) than on the pre quiz (mean = 6.63). Thirteen out of the sixteen participants received over 80% on the post quiz, whereas none of the sixteen participants received over 80% on the pre quiz. The mean of 13.0625 for the post quiz yields an average score of 87% for the post quizzes.

32
Phase IV: Post-Module Data Analysis After statistical analysis, module documents were uploaded onto the Learning Center website Allows educators to easily access the module to use in their classrooms

33
Web Sites

34
Discussion and Conclusions The results of this study demonstrated that an effective teaching module was developed for use at the high school level on the topic of ground level ozone pollution and its effects on vegetation. Further research: Testing the module on a greater number of individuals within the intended audience (high school students). Results of this study suggest that testing the module on additional students would produce a similar outcome. The module has already been incorporated into high school curricula as well as placed on websites for use by educators and the general public
. Results of this study suggest that testing the module on additional students would produce a similar outcome. The module has already been incorporated into high school curricula as well as placed on websites for use by educators and the general public.")
35
Teacher feedback One student teacher used the module in a plant science class that contained twenty three students. Feedback from this teacher was “the students did enjoy it and found the information surprising and interesting…they really thought it was neat that they could check the ozone level in their area and see surrounding areas”. Another individual who provided feedback taught the module during a plant physiology portion of their class, which contained eight students. This student teacher said about the module, “it not only tied everything I taught in the unit together, it allowed students to learn about the effect of ozone on these plant processes. The students really enjoyed the links to the internet and all the graphics”.

36
Acknowledgments My cooperators: Sabrina Chrzanowski, Don Davis, and Tracy Hoover The Pennsylvania Department of Environmental Protection, Bureau of Air Quality and the United States Environmental Protection Agency provided funding the research project that resulted in the development of this module.

37
Many thanks for your attention and interest The End and finally… Questions

Similar presentations


 Process Involvement Rosanne Sanchez New Mexico Environment Department Air Quality Bureau.>")


