Download presentation
Presentation is loading. Please wait.

1
SUBDUCTION TECTONICS, MAGMATISM AND SURFACE HEAT FLOW IN THE ANDEAN ARC Will Gosnold and Shan de Silva University of North Dakota Department of Space Studies

2
Overview Objectives Tectonic history Tectonic models Thermal evolution BDT and ignimbrite flareups HFD data Data treatment Characteristics of each HFD profile

3
Research Aim Our aim is to understand the volcanic history of the Puna and Altiplano region of the Andes. Our approach is to develop a comprehensive model of thermal, petrological, mechanical, and tectonic parameters that is consistent with the volcanic history. We synthesize these data with petrological and thermomechanical theory to develop a thermal model of the region for the past 80 my. The data we have are: the present configuration of the subduction zones based on seismology including the WBZ and seismic tomography; surface heat flow; and the geologic record of tectonics and volcanism.

4
Altiplano Puna Volcanic Complex de Silva et al., 2006

5
Temporal Development of the APVC de Silva et al., 2006 in press 10 - 1 Ma Pulses at ~10, 8, 6, 4 Ma Increasing intensity with time Migration of activity with time Catastrophic pulse at ~4Ma Markedly decreased activity after 4 Ma

6
Spatiotemporal development From de Silva et al, 2006a

7
Altiplano-Puna Volcanic Complex 10 - 1 Ma –Post-crustal thickening, plateau uplift –Syn-plateau collapse and extension? (Riller et al., 2000) –Triggered by slab-roll back and delamination (e.g. Kay et al., 1999) Area ~ 70,000 km 2 Erupted Volume >20,000 km 3 magma Monotonous dacites dominate –95% of volume 65 - 70% SiO 2 –General family resemblance –“Crustal” origin
 –Triggered by slab-roll back and delamination (e.g. Kay et al., 1999) Area ~ 70,000 km 2 Erupted Volume >20,000 km 3 magma Monotonous dacites dominate –95% of volume % SiO 2 –General family resemblance – Crustal origin.")
8
Panel from Isacks 1988 (JGR) showing the scenario for crustal thickening in the Central Andes. Flat slab subduction results in heating and volatilisation of the lower crust. Shortening results in thickened crust, densification of lower crust and lithosphere delamination. Slab roll back – slower convergence rate?

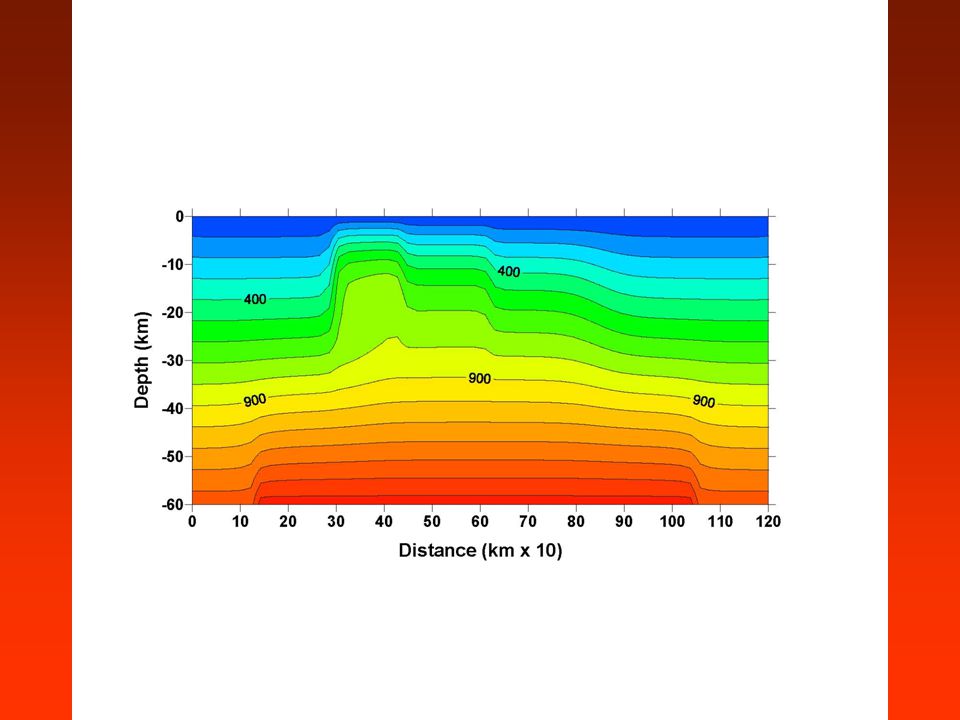
9
Temperature contours after delamination at 60 km depth Temperature contours with subduction and no slab rollback Temperature contours with subduction and slab rollback

10
Crustal Thickness data Decreased crustal thicknesses (Zandt unpublished) Decreased lithospheric thicknesses (Whitman et al, 1996; Kay et al., 1999)
 Decreased lithospheric thicknesses (Whitman et al, 1996; Kay et al., 1999)")
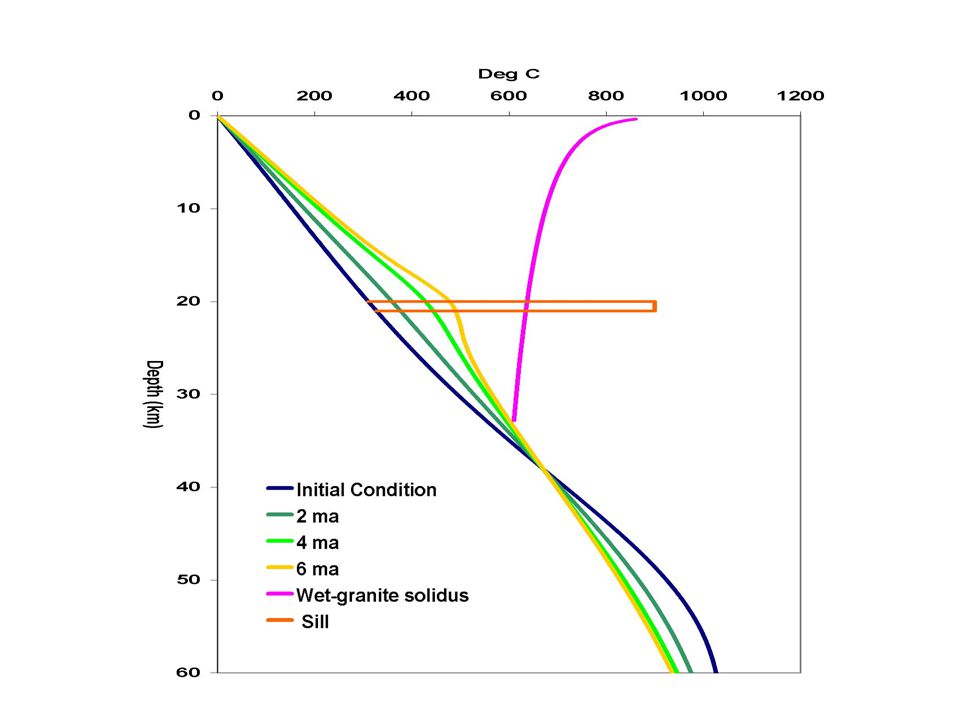
15
∆t at 1 ma∆t at 2 ma∆t at 3 ma ∆t at 5 ma∆t at 4 ma∆t at 6 ma Magma emplacements at 20 km depths were randomly distributed across a 3600 km 2 area for the first 3 ma and then across a 900 km 2 area for the next 3 ma. Magma pulses at 100,000 year intervals were scaled to emplace 7500 km 3 ma -1 for 3 ma and then 12500 km 3 ma -1 for 3 ma.

16
σ d = differential stress H = activation enthalpy R = gas constant T = temperature A & n are flow law parameters – A H (kJ mol -1 ) n –Granite 10 -8.8 123 3 –Diabase 10 -3.7 260 3.4 –Olivine 10 -3.28 123 3 References: M. Liu (2001), Kirby and Kronenberg (1987), Rutter and Brodie (1988)
, Kirby and Kronenberg (1987), Rutter and Brodie (1988).")
18
Temperature profile with counter flow in the mantle wedge Temperature profile with no counter flow in the mantle wedge.

19
Summary of Eruption Scenario Spatiotemporal patterns of ignimbrite flare-ups indicate episodic activity with increasing intensity and rapid diminution Evolving thermal state of the crust in response to a transient pulse is a framework in which the patterns can be understood –Increasing melt production with time –Hotter more ductile crust with time promotes development of larger chambers –Lid above pre-eruption magma chambers is easily induced to fail. Ignimbrite flare-ups are the result of progressive thermal and mechanical maturation of the crust

20
The Global Heat Flow Database of the International Heat Flow Commission Click on the globe to enter Global Heat Flow ( mW m^2) : 0-40 violet, 40-80 blue, 80-120 green, 120-240 yellow, 240+ red www.heatflow.und.edu
 : 0-40 violet, blue, green, yellow, 240+ red")
21
13-08-2004 Under Construction! We are in the process of uploading data so they can be downloaded as Microsoft Excel 97 spreadsheets or as ASCII files by selecting from the tables below. Not all files are on the server. Continents and Oceans Afric a xlsxls or ASCII ASCII Asia xlsxls or ASCII ASCII Antar ctica Aust ralia xls xls or ASCII ASCII Nort h Amer ica xlsxls or ASCII ASCII Glob al in RTF form at Euro pe xls xls or ASCII ASCII Sout h Amer ica xlsxls or ASCII ASCII East ern North Pacifi c East ern North Pacifi c West ern North Pacifi c West ern Sout h Pacifi cWest ern Sout h Pacifi c Cont inent al Data xls xls or ASCII ASCII Easte rn Sout h Pacifi c Nort h Atlan tic Ocea n xlsxls or ASCII ASCII India n Ocea n Medi terra nean area seasMedi terra nean area seas Ocea nic Refer ence s Refer ence s Mari ne Data xls xls or ASCII ASCII Countries North America & South America Arge ntina xlsxls or ASCII ASCII Berm uda xlsxls or ASCII ASCII Bolivi a xlsxls or ASCII ASCII Brazil xlsxls or ASCII ASCII Cana da xlsxls or ASCII ASCII Chile xlsxls or ASCII ASCII Colu mbia xlsxls or ASCII ASCII Cuba xlsxls or ASCII ASCII Ecua dor xlsxls or ASCII ASCII Mexi co xlsxls or ASCII ASCII Pana ma xlsxls or ASCII ASCII Peru xlsxls or ASCII ASCII Puert o Rico xlsxls or ASCII ASCII USA xlsxls or ASCII ASCII Countries Africa Countries Europe Austria xlsxls or ASCII ASCII Bulgaria xlsxls or ASCII ASCII Czech Republic & Slovakia xlsxls or ASCII ASCII Denmark xlsxls or ASCII ASCII Finland xlsxls or ASCII ASCII France Germany xlsxls or ASCII ASCII Great Britain xls xls or ASCII ASCII Greece xlsxls or ASCII ASCII Hungary xlsxls or ASCII ASCII Ireland xlsxls or ASCII ASCII Italy xlsxls or ASCII ASCII Iceland xlsxls or ASCII ASCII Norway xlsxls or ASCII ASCII Poland xlsxls or ASCII ASCII Romania xlsxls or ASCII ASCII Spain xlsxls or ASCII ASCII Sweden xlsxls or ASCII ASCII Switzerlan d xlsxls or ASCII ASCII Countries Oceania Australia xls xls or ASCII ASCII Japan xlsxls or ASCII ASCII New Zealand xls xls or ASCII ASCII Philippines xls xls or ASCII ASCII Sumatra xlsxls or ASCII ASCII Home Continents and Oceans Africa xlsxls or ASCIIASCII Asia xlsxls or ASCIIASCII Antarctica Australia xls xls or ASCIIASCII North America xlsxls or ASCIIASCII Global in RTF format Europe xls xls or ASCIIASCII South America xlsxls or ASCIIASCII Eastern North Pacific Eastern North Pacific Western North Pacific Western South PacificWestern South Pacific Continental Data xls xls or ASCIIASCII Eastern South Pacific North Atlantic Ocean xlsxls or ASCIIASCII Indian Ocean Mediterranean area seasMediterranean area seas Oceanic References References Marine Data xls xls or ASCIIASCII www.heatflow.und.edu

22
Countries North America & South America Argentina xlsxls or ASCII ASCII Bermuda xlsxls or ASCII ASCII Bolivia xlsxls or ASCII ASCII Brazil xlsxls or ASCII ASCII Canada xlsxls or ASCII ASCII Chile xlsxls or ASCII ASCII Columbia xlsxls or ASCII ASCII Cuba xlsxls or ASCII ASCII Ecuador xlsxls or ASCII ASCII Mexico xlsxls or ASCII ASCII Panama xlsxls or ASCII ASCII Peru xlsxls or ASCII ASCII Puerto Rico xlsxls or ASCII ASCII USA xlsxls or ASCII ASCII www.heatflow.und.edu

23
Residual Heat Flow Density contour map of South America (Hamza et al., 2005)
")
24
Locations of active volcanoes (red triangles) and heat flow sites in South America. Light blue sites are in low-angle subduction area; purple sites are in the high angle subduction area.

25
The trends of two volcanic fronts were determined and perpendicular distances from the volcanic fronts were calculated for each heat flow site. The heat flow sites shown are considered to be associated with high-angle subduction.

26
The heat flow sites shown are considered to be associated with low- angle subduction.

27
The data were smoothed using a 10-point running mean of heat flow density vs. distance from the volcanic front.

28
In the Andes region of steep subduction, HFD increases sharply to >250 mW m -2 at the volcanic front and the high HFD region extends about 200 km behind the VF. At 300 km behind the VF, HFD has declined to 60 mW m -2. HFD is relatively stable in the back arc basins as well as in Precambrian regions to the east, with values in the range of 60 to 80 mW m -2.

29
In the Andes region with sub-horizontal subduction, the transition from magmatic arc to craton is indistinguishable from normal crustal HFD variability due to age and radioactive heat production.

30
The zone of high HFD is about 300 km wide in the steeply subducting section of the Andean arc and <100 km wide in the Cascade arc. HFD variability in the flat subduction zone is indistinguishable from variability due to crustal age and radioactive heat production.

32
Plate rollback with counter flow at subduction velocity Plate rollback with counter flow at half subduction velocity Plate rollback with no counter flow

35
Andes Surface HFD and Intrusion Models

36
Conclusions Sources of anomalously high heat flow 1.Long-period of conductive heating 2.Magma intrusion in middle and upper crust Relationship of surface heat flow to crust/mantle structure 1.Slab dip and delamination may be detectable 2.Near surface magma chambers dominate the signal

Similar presentations


 showing how cool rocks of the slab pass to great depths,>")


 Thermodynamics of the Atmosphere (1911) The Origin of Continents and Oceans (1915,1929) Climate and.>")


