Download presentation
Presentation is loading. Please wait.

1
Catchment Action Plan Presented by: Lyndal Hasselman

2
OVERVIEW OF PROCESS

3
Review of the 2006 CAP + Community and stakeholder consultation + Technical panels + Reviewers phase (community, stakeholder, technical) Public exhibition (12 th November) Submit to Minister (1 st February)
 Public exhibition (12 th November) Submit to Minister (1 st February)")
4
STRUCTURE OF THE CAP

5
Social-ecological systems

6
Table of Contents 1.Lachlan Catchment 2.Tablelands 3.Mixed Farming Slopes 4.Lachlan Plains 5.Lachlan Rangelands 6.Lower Lachlan Floodplains

7
Lachlan Catchment Broad directions Focus on how we can leverage towards a vision The overall package resulting from the social-ecological systems e.g. which has revegetation as more important e.g. which has riparian health as more important

8
Each social-ecological system section System description Values Changes Vision Desired outcomes and priorities Change mechanisms Performance measures the current system identity the disturbances impacting on the system the future system identity where to prioritise, to make a difference what approach, to make a difference knowing if we are on track 3-5 year implementation plans for each social-ecological system

9
VISION

10
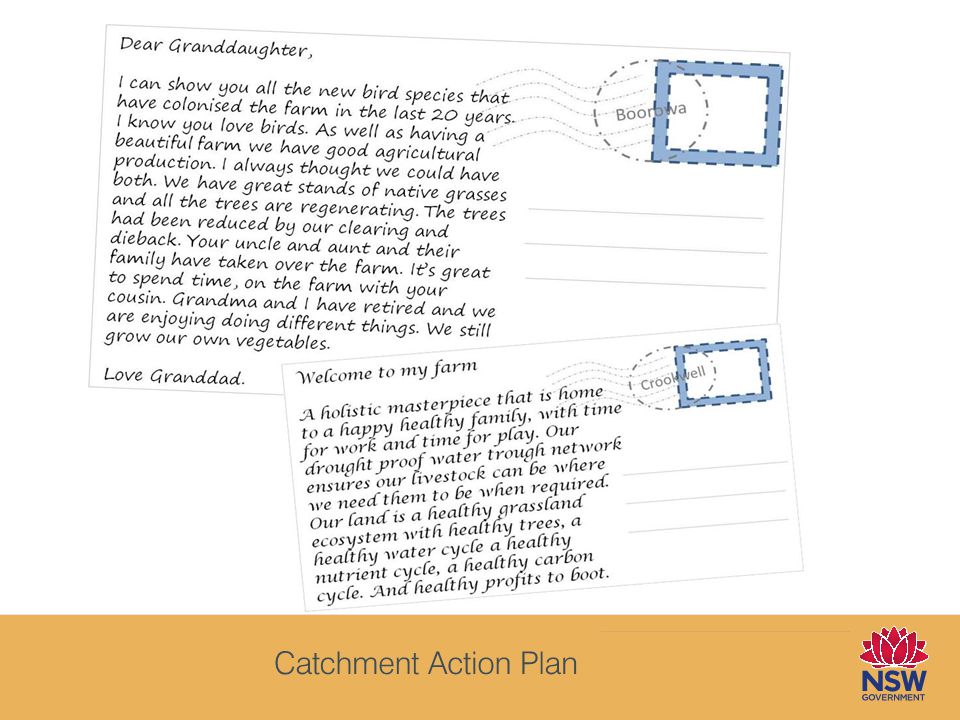
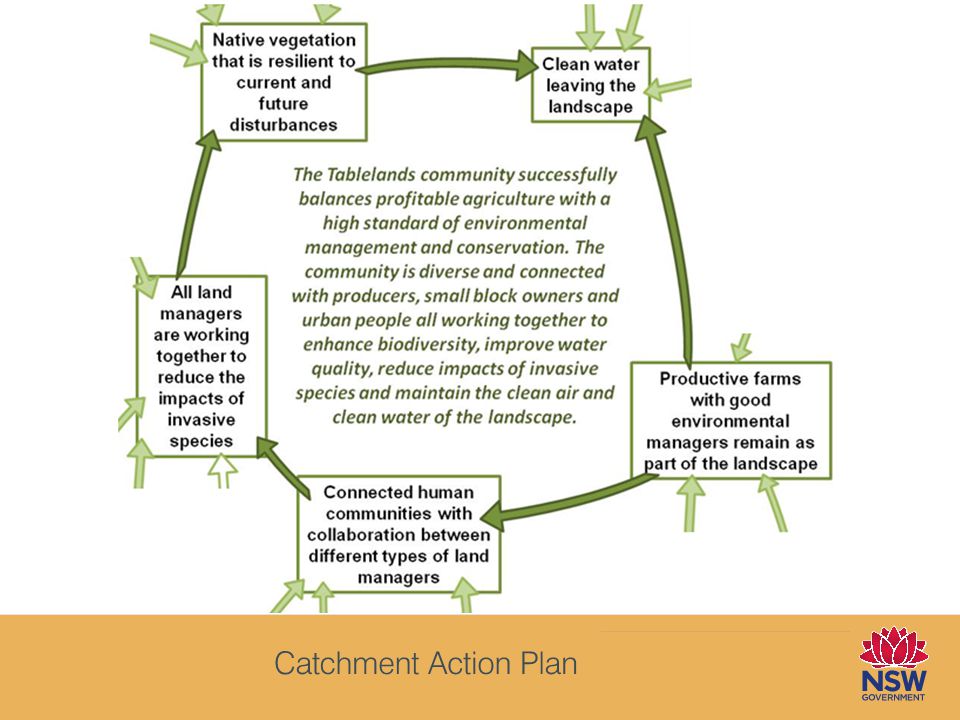
e.g. Tablelands The Tablelands community successfully balances profitable agriculture with a high standard of environmental management and conservation. The community is diverse and connected with producers, small block owners and urban people all working together to enhance biodiversity, improve water quality, reduce impacts of invasive species and maintain the clean air and clean water of the landscape.

12
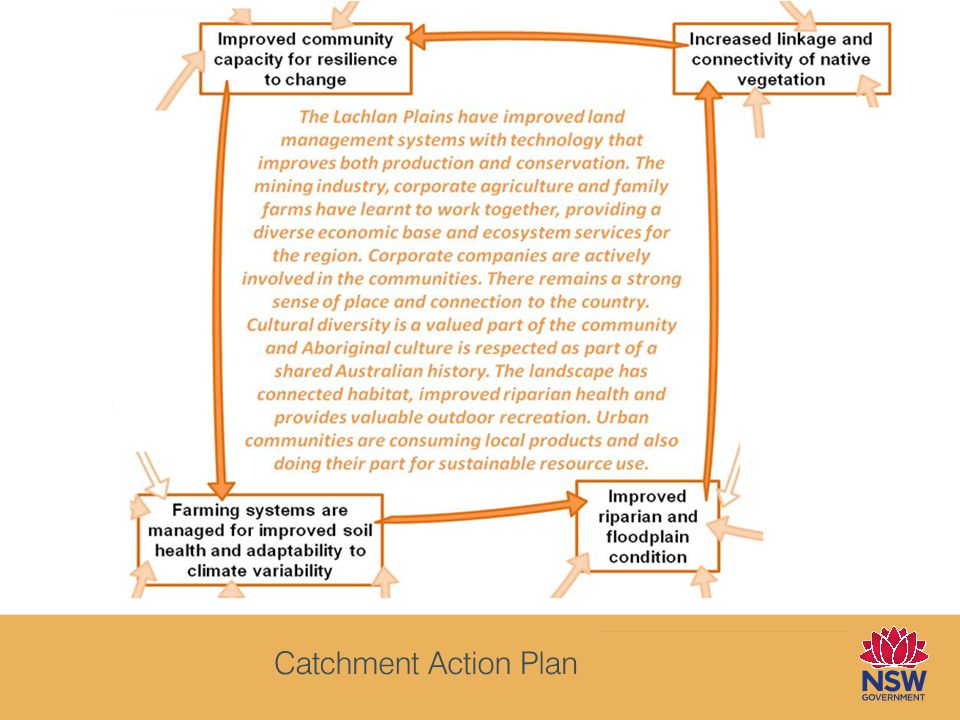
e.g. Lachlan Plains The Lachlan Plains have improved land management systems with technology that improves both production and conservation. The mining industry, corporate agriculture and family farms have learnt to work together, providing a diverse economic base and ecosystem services for the region. Corporate companies are actively involved in the communities. There remains a strong sense of place and connection to the country. Cultural diversity is a valued part of the community and Aboriginal culture is respected as part of a shared Australian history. The landscape has connected habitat, improved riparian health and provides valuable outdoor recreation. Urban communities are consuming local products and also doing their part for sustainable resource use.

14
What do you think of the vision?

15
DESIRED OUTCOMES

16
Program logic Program logic is the rationale behind a program – the understood cause-and-effect relationships between program activities, outputs, intermediate outcomes, and longer term desired outcomes. Represented as a diagram or matrix, program logic shows a series of expected consequences, not just a sequence of events.

17
Input Output Intermediate outcome Long term outcomes The key components of a program logic can be likened to a drop landing in a pond and the resulting ripple effect towards the banks of the pond.

20
PRIORITIES

21
Priorities to focus or target Spatial parts People parts System parts

22
Each desired outcome, has two or three priorities

23
What do you think of the priorities?

24
Are there better priorities? Refined priority LachLandcare priority? Are there other priorities?

25
LachLandcare priority? LachLandcare action? Partner’s action?

26
???

27
PERFORMANCE MEASURES

28
Are we on track?

29
Performance measures Are we headed in the right direction Are we on track? towards our desired outcomes? towards our priorities?

30
Performance measure Levels of success emergingacceptablegoodvery good Area of native vegetation Native vegetation increased by 6,000 hectares (to 21.5% native vegetation) Native vegetation increased by 16,000 hectares (to 22.5% native vegetation) Native vegetation increased by 40,000 hectares (to 25% native vegetation) Native vegetation increased by 90,000 hectares (to 30% native vegetation) Levels of success Emerging – starting to show/develop
 Native vegetation increased by 16,000 hectares (to 22.5% native vegetation) Native vegetation increased by 40,000 hectares (to 25% native vegetation) Native vegetation increased by 90,000 hectares (to 30% native vegetation) Levels of success Emerging – starting to show/develop")
31
CHANGE MECHANISMS

32
Change (policy) mechanisms Regulation Education and advocacy Financial incentives Direct action Research
 mechanisms Regulation Education and advocacy Financial incentives Direct action Research")
33
WORKING TOGETHER

34
Towards the same vision On the same priorities On different priorities In the same way (change mechanism) In different ways (change mechanisms) relative to our strengths
 In different ways (change mechanisms) relative to our strengths")
36
“What do you value about this landscape or place? Select three responses.” What’s important to our communities $

Similar presentations


 Peel Chapter Meeting November 19, 2009 Dr. David Mowat, Medical.>")


 Theresa Kamau Kas Program Director - Manus.>")


 80+ organizations (government and non-government) working together to achieve shared conservation.>")

 Broad and narrow in scope Narrow.>")