Download presentation
Presentation is loading. Please wait.

1
Penn State Spring Admissions Conference May 24, 2011 Sheryl Sobiesiak Sr. Educational Manager

2
The Cost of Doing “Business” Demographics Across the Country, Region, State, Regions within PA Student Choices, College Completion, Finances To Change or Not To Change?

3
ApplicantAdmittedEnrolled Total$578.08$836.49$2,366.08 Control Public342.54470.211,002.02 Private668.23976.672,894.65 Enrollment Fewer than 3,000710.791,042.882,963.46 3,000 to 9,999365.68512.471,743.22 10,000 or more293.27389.79841.30 Selectivity Accept fewer than 50% of applicants422.011,072.233,384.62 50 to 70%555.45875.302,451.30 71 to 85%611.64769.292,138.28 More than 85%642.03774.062,053.44 Yield Enroll fewer than 30% of admitted students559.13836.703,030.48 30 to 45%566.12813.552,303.32 46 to 60%503.41834.431,756.79 More than 60%830.31955.801,535.16 SOURCE: NACAC Admission Trends Survey, 2008

7
Source: WICHE, Knocking at the College Door, 2008

9
Number of High School Graduates, 1994-2022: United States Source: WICHE/The College Board

10
Source: WICHE, Knocking at the College Door, 2008

11
Number of High School Graduates, 1992-2022: Midwest Source: WICHE/The College Board

12
Number of High School Graduates, 1992-2022: New England Source: WICHE/The College Board

13
Number of High School Graduates, 1994-2022: West Source: WICHE/The Colllege Board

14
Number of High School Graduates, 1992-2022: Southwest Source: WICHE/The College Board

15
Number of High School Graduates, 1993-2022: South Source: WICHE/The College Board

16
Number of High School Graduates, 1992-2022: Middle States Source: WICHE/The College Board

17
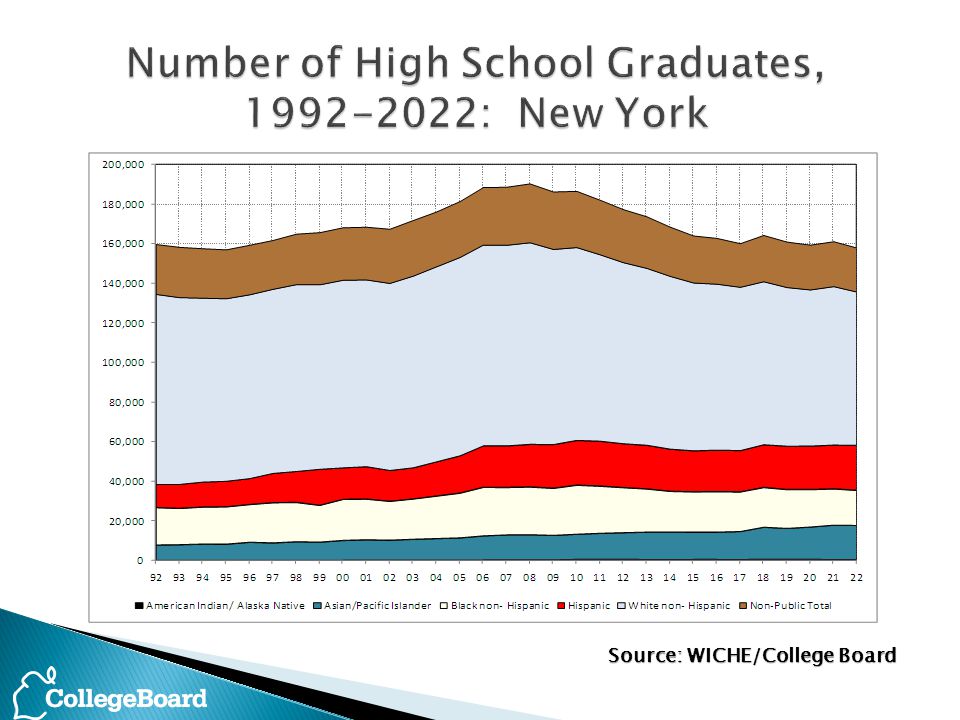
Source: WICHE/College Board

21
Number of High School Graduates, 1992-2022: New Jersey Source: WICHE/The College Board

22
EPS GeomarketsEPS CodeProj Grad Chg Pct 2008-2011Proj Grad 2008-2009Proj Grad 2009-2010Proj Grad 2010-2011 Bergen CoNJ103.110,13410,14110,257 Camden & Burlington CoNJ 2-4.710,93410,82410,575 Essex & Southern Passaic CoNJ 8-7.312,07411,95311,526 Hudson CoNJ 99.15,4495,6385,735 Jersey Shore & PinelandsNJ 3-1.511,30311,09811,140 Middlesex CoNJ 4-.26,8547,0487,190 Monmouth CoNJ 52.19,0849,2539,275 Morris & Northern Passaic CoNJ1136,6266,7026,937 Somerset & Mercer CoNJ 6.46,8846,9347,171 Southern JerseyNJ 12.55,2175,0655,169 Sussex, Warren, & Hunterdon CoNJ124.75,4255,4335,635 Union CoNJ 7-3.86,7216,8286,664

23
Source: WICHE/College Board

24
EPS GeomarketsEPS Code Proj Grad Chg Pct 2008-2011 Proj Grad 2008-2009Proj Grad 2009-2010 Proj Grad 2010- 2011 Allegheny CoPA12-10.711,69911,47210,807 Bucks CoPA 1-3.97,5497,3607,384 Chester CoPA 21.25,1175,3105,240 Delaware CoPA 3-.65,1505,0545,015 Lehigh ValleyPA 6.917,85017,93817,923 Montgomery CoPA 4-1.18,2267,9767,992 North Central PennsylvaniaPA 8-9.47,5737,4607,075 Northeastern PennsylvaniaPA 7-.56,6796,5326,578 Northwestern PennsylvaniaPA 9-6.57,9927,8447,523 Philadelphia CoPA 5-.211,36111,59211,499 Southern Pennsylvania (East)PA10-321,95721,01920,794 Southern Pennsylvania (West)PA11-6.85,5545,4205,301 Southwestern PA (w/o Allegheny Co)PA13-.815,93915,75615,762
PA10-321,95721,01920,794 Southern Pennsylvania (West)PA ,5545,4205,301 Southwestern PA (w/o Allegheny Co)PA ,93915,75615,762")
25
Number of High School Graduates, 1992 to 2022: Florida Source: WICHE/The College Board

26
Number of High School Graduates, 1992-2022: California Source: WICHE/The College Board

27
Number of High School Graduates, 1992-2022: Texas Source: WICHE/The College Board

28
Percent of Total Postsecondary School Enrollment for Each Ethnic Group by Institution Type 2002 NCES. The Condition of Education 2005

29
Source: NCES. Status and Trends in the Education of Racial and Ethnic Minorities, Table 26.2, 2007 All students = 28%

30
Our Challenge 30

37
100 For every 100 9 th graders… 69 graduate from high school enter college 42 return to college for their sophomore year 28 earn a bachelor’s degree within six years 20 Source: The National Center for Higher Education Management Systems Progress & Completion dataThe National Center for Higher Education Management Systems 37

38
Distribution of Full-Time Undergraduates at Four-Year Institutions by Published Tuition and Fees, 2010-11 SOURCE: The College Board, Trends in College Pricing 2010, Figure 2.

39
Average Annual Percentage Increases in Inflation-Adjusted Published Prices by Decade, 1980-81 to 2010-11 SOURCE: The College Board, Trends in College Pricing 2010, Figure 4.

40
Percentage Growth in Mean Family Income by Quintile in Constant 2009 Dollars, 1979–1989, 1989–1999, and 1999–2009 SOURCE: The College Board, Trends in College Pricing 2010, Figure 16A.

41
Median Family Income by Selected Characteristics, 2009 SOURCE: The College Board, Trends in College Pricing 2010, Figure 16B.

42
Percentage Distribution of Enrollment of Full-Time Undergraduate Students and All Undergraduate Students in Degree-Granting Programs, by Sector, Fall 2008 SOURCE: The College Board, Trends in College Pricing 2010, Figure 18.

43
How will you deal with the increase/decrease in number of high school graduates? Territory management How consistent are your approaches with the values of new populations? More emphasis on family, need for personal attention, multi-lingual Use of technology How will you accommodate students who may not be college-ready? Importance of outreach, academic preparation

44
How many students can you admit? Increase selectivity? Soft applicants? Yield? How do your policies affect under- represented students? Requirements, deadlines How will your selection process change to ensure meeting institutional objectives? Definition of merit Institutional interests

45
How do you communicate with students regarding financial aid? Issues of affordability/financial literacy Consistent voice for institution How will you control expenditures? Pricing strategy and budget implications Impact on admissions How do your current financial aid awarding policies and packaging parameters affect students? Leveraging

46
Questions & Discussion

47
Sheryl Sobiesiak Sr. Educational Manager ssobiesiak@collegeboard.org 610-227-2553

Similar presentations


 Interrelated surveys conducted annually by the National Center for Education Statistics (NCES)>")
 101 North Front.>")


, 2003-04 to.>")

