Download presentation
Presentation is loading. Please wait.

2
Legislative Session Summary Enrollment Tuition FY06 Operating Budget 2005-07 Capital Budget

3
FY06FY07 Tuition Increase maximum for RU (25% Recapture) (25% Recapture)6%6% New Enrollment Funding (324 FTES in FY06 and 326 FTES in FY07) 2,147,0002,167,000 High Demand Enrollment (Phys Therapy, Comp & Engr Tech, Special Ed, Dental Hygiene) 741,000* Autism Center 212,000* Maintenance & Operating Shift to Capital (245,000)* Non-Instruction Reduction (98,000)* Tuition Rate Increase - GFS Capture (432,000)* Salary Increase Funding (Classified 3.2/1.6%, Non-Represented 3.2/1.6%) (Classified 3.2/1.6%, Non-Represented 3.2/1.6%)1,315,000927,000 Health Benefit Changes 831,000* * FY07 Funding level remains flat -- no additional funding for FY07
 (25% Recapture)6%6% New Enrollment Funding (324 FTES in FY06 and 326 FTES in FY07) 2,147,0002,167,000 High Demand Enrollment (Phys Therapy, Comp & Engr Tech, Special Ed, Dental Hygiene) 741,000* Autism Center 212,000* Maintenance & Operating Shift to Capital (245,000)* Non-Instruction Reduction (98,000)* Tuition Rate Increase - GFS Capture (432,000)* Salary Increase Funding (Classified 3.2/1.6%, Non-Represented 3.2/1.6%) (Classified 3.2/1.6%, Non-Represented 3.2/1.6%)1,315,000927,000 Health Benefit Changes 831,000* * FY07 Funding level remains flat -- no additional funding for FY07")
4
8,850 FTES Projected for FY06 No change over FY05 Budgeted Level No Constraint On Enrollments 8,593 FY06 State Funded FTES 324 FTES increase over FY05 State funded level Enrollment levels exceed state funding by 257 FTES

5
6% Tuition Increase for Resident Undergraduates & Resident Graduates 25% Tuition Recapture by State 0% Tuition Increase for Non-residents 6% S&A Fee Increase for All Students

6
CategoryOperatingFeeBuildingFeeS&AFeeResidents Undergraduate Undergraduate$1,156.96$46.04$145.00 Graduate Graduate$1,851.53$46.47$138.00 Non-Resident Undergraduates Domestic Domestic$4,125.84$170.16$143.00 International International$4,125.84$170.16$143.00 Non-Resident Graduates Domestic Domestic$5,397.79$166.21$136.00 International International$5,397.79$166.21$136.00 Mandatory fees are assessed separately i

7
Category FY 05 Tuition Rates FY06 Tuition Rates Resident Undergraduate $3,822$4,044 Resident Graduate $5,772$6,111 Non-Resident Undergraduate $13,299$13,317 Non-Resident Graduate $17,085$17,100 S&A Fee Included – Other Mandatory fees assessed separately. $18 $222 i $339 $15

8
Category FY 05 Fees FY06 Fees Technology Fee $105.00$105.00 Health Clinic Fee $112.02$115.17 Health & Wellness Fee $16.47$16.95 Total Fees $233.49$237.12 No Change All categories of students pay the same level of mandatory fees. Mandatory Fees increased by the Fiscal Growth Factor only. i $3.15 $0.48 $3.63

9
Student Impact 6% Grant Funds Available to Offset Impact High-Need Students $222$232 Low/Medium Need Students $222$0-$232 Resident Undergraduate *The State Need Grant award amounts were increased by the State to match an assumed 6 percent tuition increase and the eligibility range was increased from 55 percent of median family income (MFI) to 65 percent of MFI. Students who are not eligible for State Need Grant will receive varying amounts of additional grant and loan assistance to pay for the increase, or will pay out of pocket. i

12
Percent

13
Discount Rate held at 18.0%Waivers14.0% Waivers for Scholarships 250,000 Section 6010 Waivers 1,335,240 Financial Aid held at 05 Level EWU Financial Aid 3.5% Addition to Fin. Aid 210,334 FTES8,850Headcount9,009 FTES/HC Conversion Rate 1.018 Enrollment Mix FY 05 Mix Interest Income $95,000Uncollectibles1.2% President’s Reserves $300,000 Fund Balance Invest. $300,000 Enrollment Assumptions Waiver Assumptions Policy Assumptions Financial Aid Assumptions

14
Gross Operating Fee Revenue $ 39,631,699 Less: Tuition Waivers Less: Tuition Waivers-5,548,313 3.5 % EWU Financial Aid 3.5 % EWU Financial Aid-1,176,242 Uncollectible Allowance Uncollectible Allowance-475,570 Plus: Interest Income Plus: Interest Income95,000 Less: Additional Waiver Authority Less: Additional Waiver Authority-1,335,240 Additional Financial Aid Additional Financial Aid-210,334 Quality (3.8 GPA) Scholarships Quality (3.8 GPA) Scholarships-250,000 Investment in Fund Balance Investment in Fund Balance-300,000 President’s Reserve President’s Reserve-300,000 Net Operating Fee Revenue $ 30,131,000 Net New Policy Revenue $ 705,000
 Scholarships Quality (3.8 GPA) Scholarships-250,000 Investment in Fund Balance Investment in Fund Balance-300,000 President’s Reserve President’s Reserve-300,000 Net Operating Fee Revenue $ 30,131,000 Net New Policy Revenue $ 705,000")
15
Net New Policy Revenue 705,000Less: 25% Tuition Recapture - $432,000 (Half in FY06 and half in FY07) 216,000 Non-Instruction Reduction 98,000 Net Remaining $ 391,000
 216,000 Non-Instruction Reduction 98,000 Net Remaining $ 391,000")
16
Business & Public Administration (37,772) Education & Human Development 47,661 Social & Behavioral Sciences 254,082 Arts & Letters 107,476 Social Work 70,871 Science, Math & Technology 581,621 Total Instruction Distribution 1,023,939
 Education & Human Development 47,661 Social & Behavioral Sciences 254,082 Arts & Letters 107,476 Social Work 70,871 Science, Math & Technology 581,621 Total Instruction Distribution 1,023,939")
17
Academic Affairs Administration 94,437 Library Library77,986 Information Technology Information Technology80,107 Academic Affairs Subtotal 252,530 Business & Finance 273,845 Student Affairs 82,353 University Advancement 45,392 President’s Office 57,941 Total Non-Instruction Distribution 712,061

18
Non-Represented Employee Increase 3.2% COLA effective September 1, 2005 Classified Employee Increase 3.2% COLA effective July 1, 2005

19
Instruction $ 41,037,026 Research291,483 Public Service 258,897 Academic Support 5,027,019 Libraries4,245,414 Student Services 7,232,373 Institutional Support 10,926,428 Plant Operations & Maintenance 9,696,360 Total Ledger 1 $ 78,715,000 This budget represents a 7.8% increase over FY05 i

20
Revenues / Additions Expenditures / Deductions Dedicated Local Funds (Ledger 2) $15,451,006$16,657,636 Service Funds (includes recharges) 4,406,7434,112,560 ASEWU2,348,5792,425,729 Intercollegiate Athletics 3,130,9693,130,969 Bookstore6,496,4196,387,535 Pence Union Building 924,142862,781 Parking600,000577,167 Housing & Dining 13,369,67813,115,793 Scholarships & Fellowships 18,860,00018,860,000 Sponsored Programs & Contracts 14,445,00014,445,000 Total $ 80,032,536 $ 80,575,170
 $15,451,006$16,657,636 Service Funds (includes recharges) 4,406,7434,112,560 ASEWU2,348,5792,425,729 Intercollegiate Athletics 3,130,9693,130,969 Bookstore6,496,4196,387,535 Pence Union Building 924,142862,781 Parking600,000577,167 Housing & Dining 13,369,67813,115,793 Scholarships & Fellowships 18,860,00018,860,000 Sponsored Programs & Contracts 14,445,00014,445,000 Total $ 80,032,536 $ 80,575,170")
21
Educational and General State and Tuition State and Tuition $ 78,715,000 Dedicated Local Funds, Service funds (net) Dedicated Local Funds, Service funds (net)16,458,703 Total Educational and General 95,173,703 Auxiliary Enterprises (including transfers) Auxiliary Enterprises (including transfers)26,499,974 Scholarships and Fellowships Scholarships and Fellowships18,860,000 Sponsored Programs Sponsored Programs14,445,000 FY06 Annual Operating Budget $ 154,978,677 This budget represents an 8% increase over FY05 i
 Dedicated Local Funds, Service funds (net)16,458,703 Total Educational and General 95,173,703 Auxiliary Enterprises (including transfers) Auxiliary Enterprises (including transfers)26,499,974 Scholarships and Fellowships Scholarships and Fellowships18,860,000 Sponsored Programs Sponsored Programs14,445,000 FY06 Annual Operating Budget $ 154,978,677 This budget represents an 8% increase over FY05 i")
22
It is recommended that the Board of Trustees approve a 6% tuition rate increase for resident students and a 6% service and activity fee increase for all fee paying categories for fiscal year 2006, which begins July 1, 2005 and ends June 30, 2006.

23
It is recommended that the Board of Trustees approve the operating budget of $154,978,677 for fiscal year 2006, which begins July 1, 2005 and ends June 30, 2006.

25
Hargreaves Hall Design Cheney Hall Renovation $ 1,414,000 $ 2,002,000

26
Health, Safety, Code Compliance $ 5,700,000 Fire alarm systems for 5 bldgs. Fire panels, generators, hydrants Elevator safety upgrades General safety issues Infrastructure Preservation $ 4,000,000 Steam line replacement Water dist. system upgrades Elect & lighting improvements General upgrades Facility Preservation $ 8,000,000 ADA building upgrades HVAC renovation/upgrades Roof replacements Interior & exterior bldg restorations Landscaping & sidewalks

27
$ 15,600,000 STATE FUNDS - $6,600,000 Enhance Classroom Classroom Renewal WWF New Track Surface Network Upgrades Emergent Needs General Bldg Upgrades/ADA LOCAL FUNDS - $9,000,000 FRS Upgrade Playfield Expansion Improve Res. Walkway Art Walk Development Campus Signage Red Barn Interior Renov. General Prog. Upgrades

28
Repairs to: Heating, Ventilation Plumbing & Electrical Elevators External & Internal Building Surfaces $ 2,217,000

29
ProjectRe-Appropriation Senior Hall $ 9,938,000 Cheney Hall 3,059,000 Campus Network Upgrade 2,215,000 Visitor Center & Formal Entry 900,000 Facility Preservation Backlog 1,500,000 Minor Works Preservation 566,168 Water System Pres. & Expansion 196,072 Infrastructure Preservation 250,000 Total 05-07 Reappropriations $ 18,624,240

30
ProjectAmount Parking Lot Improvements $ 50,000 Morrison Window Project 300,000 Housing – Minor Capital 200,000 Tawanka Dining Project 100,000 Total $ 650,000

31
Fund Source Amount New Appropriations State Bldg Construction State Bldg Construction $ 27,716,000 EWU Capital Projects EWU Capital Projects9,000,000 Education Construction Education Construction2,217,000 Reappropriations18,624,240 FY 06 Local Funded Projects 650,000 Total $ 58,207,240

32
It is recommended that the Board of Trustees approve the capital budget of $58,207,240 for the 2005-07 biennium, which begins July 1, 2005 and ends June 30, 2007.

36
Physical Plant reduction offset to Capital Budget $245,000 Per 2005-07 legislative budget maintenance and operations shift to capital i

37
Autism Center - $212,000 “Inclusive preschool for children identified with autism spectrum disorder” Cooperative partnership between: Eastern Washington University Northwest Autism Center Sacred Heart Medical Center

38
Additional State Enrollments 324 FTES 324 FTES $ 2,147,000 Less: Enrollment Mix Impact (411,000) Net $ 1,736,000 All enrollment funds are distributed using the Strategic Resource Allocation Model. i

39
2003-05 Allocations to GFS = $741,000 FY2004 Physical Therapy - 8 FTES Computing/Engineering Sciences – 38 FTES FY2005 Special Education – 20.5 FTES Dental Hygiene – 6.5 FTES

40
8,850 FTES Projected for FY06 No Increase over FY05 Budgeted Level No Constraint On Enrollments 8,593 FY06 State Funded FTES

41
Eastern proposes the following FY06 operating and capital budgets for discussion today and action of the Board of Trustees at the June 24, 2005 meeting.

43
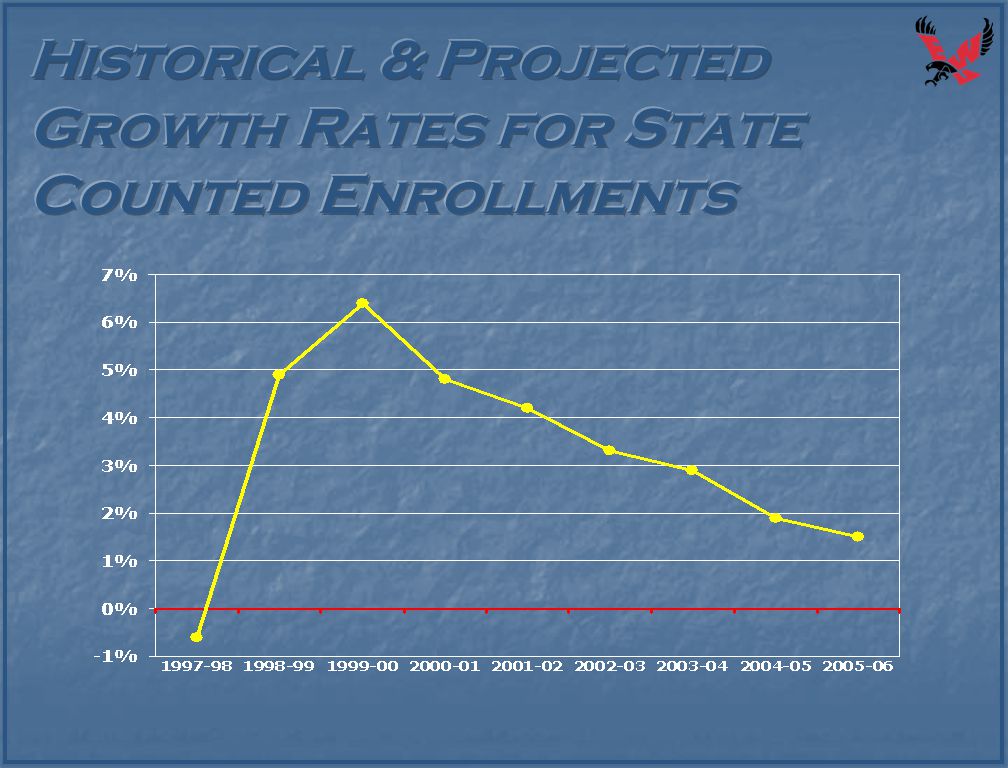
Experienced rapid overall enrollment growth can be attributed to: Significant growth in new students- primarily new freshmen who would remain in the system for anywhere from four to six years. In the six years, the freshman class size doubled- from the low of 672 in 1997 to 1,345 in 2003. This was accomplished by the large growth in both in-state and out of state students. Over the same time period, transfer and graduate numbers remained flat. While the 2005-06 overall state funded growth rate is expected to slow, it is important to note we will again have a record freshman class size projected to be at least 1,530--- compared to 1,426 last year. Spokane county freshman applications are at a record high.

44
EWU made deliberate efforts in the spring of 2002 to see better prepared transfer students enter the institution by requiring transfer students to enter ready for college level English and math. This lowered the number of new transfer students- while contributing to ideal shaping of our overall enrollments. Larger incoming classes become larger graduating classes. Growth in new non-resident students has leveled off. Increased graduation rates in the last four years- 4 year has increased by 5.8% and 5 year by 4.5%. Many new enrollments- particularly at the graduate level, have been experienced in self-support programs. Legislation has been passed that has required new policies that hold students more accountable. EWU experienced a large decrease in new international students which has just recently begun to turn around. At the conclusion of the 6 year cycle, the growth has slowed due to multiple factors:

45
Four Year Institutions 2004-2015 (OFM June 2003) -400 -200 0 200 400 600 800 1,000 1,200 1,400 04-0505-0606-0707-0808-0909-1010-1111-1212-1313-1414-15 State FTE growth needed to maintain current participation rates through the 2011-12 academic year.
 ,000 1,200 1, State FTE growth needed to maintain current participation rates through the academic year.")
47
Washington State Public School Enrollment Comparison Percent Change in Enrollment 1999-2003 (OSPI - May 2004) -10% -5% 0% 5% 10% 15% 20% 25% 30% 35% HispanicAsianAfrican AmericanAmerican IndianCaucasian
 -10% -5% 0% 5% 10% 15% 20% 25% 30% 35% HispanicAsianAfrican AmericanAmerican IndianCaucasian")
49
FY2005FY2006

51
Exemptions 15% to Academic Affairs

52
Projection

56
Projected Annualized FTES

60
State FTE Percentage by Course Level (Fall 2004 HEER* Data) Student Class Standing by Headcount Percentage- State (10 th Day Fall 2004) All Self Support/Off Campus FTE = 642 * Higher Education Enrollment Report- excludes all self support- including EWU Running Start, Independent Learning, ELI, AUAP, ROTC Contracts and state funded waivers. Freshman/Sophomore 37% (3,647 HC)
.")
61
Cheney/Spokane Off Campus Sites and/or self support FTE = 1,420 + 156 FTE/+1% + 191 FTE/-2% + 567 FTE/+1% Growth from Fall 2004 base (10,308) needed to meet 2010 goal: +778 FTE = 1,692 FTE Growth to reach 12,000 Total FTE Based on goals submitted to Council of Presidents.
 needed to meet 2010 goal: +778 FTE = 1,692 FTE Growth to reach 12,000 Total FTE Based on goals submitted to Council of Presidents.")
62
Recruitment: Both in-state and out of state initiatives are needed given current environment in the State of Washington (domestic and international). Branch campus admission of freshmen Community colleges offering four year degrees Downturn in growth rates Increased competition amongst higher education institutions. Retention: We must place more of a focus on the sophomore to junior, junior to senior and ultimately graduation rates. Comprehensive campus-wide efforts are needed to grow our FTE level, and to maintain the base levels by respective category. If we are to see growth rates as experienced in the past- we need to focus on:

64
Dollars

65
FundAmount001 $ 84,853,000 14958,342,000 14826,414,790 4xx192,200 5xx51,591,582 84638,025,000 14527,025,013 Total $ 286,443,585 Note: Service Funds figure does not include $4,020,424 in recharges.

66
FundAmount001 $ 99,667,000 $ 99,667,000 149 61,774,930 61,774,930 148 31,365,542 31,365,542 4xx 193,358 193,358 5xx 54,545,668 54,545,668 846 39,026,750 39,026,750 145 29,323,350 29,323,350 Total $ 315,896,598 Note: Service Funds figure does not include $4,311,493 in recharges.

67
The dedicated local fund provides educational programs which support the mission of the university but that are not directly funded by the Washington State Legislature. Programs in this fund include Self-Support Academic Programs, Running Start, Summer Session, International Field Studies, Study Abroad, University Press, course fees and other continuing education courses. Revenues15,451,006Expenditures15,841,349 Expenditures exceed revenues due to the use of fund balances in the accounts – primarily investment in distance education programs. Expenditures exceed revenues due to the use of fund balances in the accounts – primarily investment in distance education programs. i

68
Revenues/Recharges4,406,743Expenditures/Deductions 4,339,031 The service activities or internal revolving funds provide goods and services for other university functions. Service funds include stores operations, printing and duplicating, workforce construction, telecommunication services, and motor pool.

69
This enterprise includes the operation of student government and provides funds for concerts, social activities, campus recreation, commuting services, student publications such as The Easterner, clubs and organizations and other associated student sponsored activities. Revenues/Additions2,348,579Expenditures/Deductions 2,425,729 Expenditures exceed revenues due to the use of fund balances in the accounts – funding the Tri-Agency and STA agreements. Expenditures exceed revenues due to the use of fund balances in the accounts – funding the Tri-Agency and STA agreements. i

70
The intercollegiate athletics fund includes program support costs, travel, and scholarships granted to student participants based on their athletic ability. Revenues/Additions3,130,969Expenditures/Deductions 3,130,969 This represents the Self-Support portion of the athletics budget. Intercollegiate Athletics also receives $1,827,202 in State funding.

71
The bookstore serves the students with textbooks, supplies, computer hardware and accessories, gift items and EWU merchandise. Revenues6,496,419Expenditures/Deductions 6,387,535

72
The PUB provides a central gathering place that serves as the hub of college life for the university. It provides for services, conveniences, and amenities the members of the college family need in their daily lives on campus and for getting to know and understand each other through informal association outside the classroom. Revenues924,142Expenditures/Deductions 862,781

73
Parking services provides for the parking on campus, and promotes safety and customer services to faculty, staff, students and visitors. In addition, Parking Services maintains and improves the campus parking lots. Revenues600,000Expenditures/Deductions577,167

74
The housing and dining program provides room, board and event planning services for students, staff and visitors of the university. It provides a safe, pleasant and well-maintained environment that supports the educational, personal and social growth of all residents. Revenues13,369,678Expenditures/Deductions 13,115,793

75
2002-032003-042004-052005-06 Federal Grants (includes Pell grant and the Supplemental Educational Opportunity Grant – SEOG) 8,968,8139,553,8359,216,0009,544,000 State Grants (includes State Need Grant) 6,832,7077,245,4007,356,0007,355,000 EWU Grants (includes EWU grant, endowed scholarships and license plate) 1,306,4261,425,6661,433,0001,436,000 Private Grants (foundation endowed scholarships) 465,334446,239515,000525,000 Total17,573,28018,671,14018,520,00018,860,000 Scholarships and Fellowships include funds for student aid programs, some federal and state aid programs and privately endowed scholarships.
 8,968,8139,553,8359,216,0009,544,000 State Grants (includes State Need Grant) 6,832,7077,245,4007,356,0007,355,000 EWU Grants (includes EWU grant, endowed scholarships and license plate) 1,306,4261,425,6661,433,0001,436,000 Private Grants (foundation endowed scholarships) 465,334446,239515,000525,000 Total17,573,28018,671,14018,520,00018,860,000 Scholarships and Fellowships include funds for student aid programs, some federal and state aid programs and privately endowed scholarships.")
76
2002-032003-042004-052005-06Federal 6,601,446 6,601,446 6,393,425 6,393,425 5,369,000 5,369,0005,848,000 State 2,874,904 2,874,904 3,049,788 3,049,788 3,864,000 3,864,0003,464,000 Local 1,740,064 1,740,064 2,224,936 2,224,936 2,297,000 2,297,0002,273,000 Private 2,368,089 2,368,089 2,375,546 2,375,546 2,480,000 2,480,0002,614,000 Other 277,404 277,404 260,098 260,098 231,000 231,000246,000 Total13,861,90714,303,79314,241,00014,445,000 Sponsored Programs include research grants, state work study funds, local grants, distinguished professorships.

77
Higher Education Prioritization List 2005-07 EWU Capital Request $52.3 Million 2005-07 Conference Committee Capital Budget $38.9 Million 2005-07 EWU Capital Budget Spring 2004 Fall 2004 April 2005

Similar presentations


 Recommendation to The University of Texas Board of Regents (Revised) Recommendation to The University of Texas.>")


 Salaries and Wages Utilities Supplies.>")
 AUXILIARY ENTERPRISES STUDENT ACTIVITIES CAPITAL.>")


