Download presentation
Presentation is loading. Please wait.

1
Depositional, Diagenetic and Tectonic Complexity of the San Andres on the Central Basin Platform
Bob Trentham CEED UTPB

2
Problem Statement The Guadalupian on the Central Basin Platform has produced more oil than any other reservoir in the Permian Basin (>3.5 BBO). However, percent recoveries from primary, secondary and tertiary methods is low (ranging from 11 to 50%). In part, this is a function of a “postage stamp” mentality where workers, both geologists and engineers, become experts in particular fields. This leads to an incomplete understanding of the regional which in turn reduces the potential for enhance reserve recovery.
. However, percent recoveries from primary, secondary and tertiary methods is low (ranging from 11 to 50%). In part, this is a function of a postage stamp mentality where workers, both geologists and engineers, become experts in particular fields. This leads to an incomplete understanding of the regional which in turn reduces the potential for enhance reserve recovery.")
3
Naming Convention Holt on Central Basin Platform = Leonardian 7 and 8 of Kerans = lower Cutoff? Called lower SA1 and lower SA2 in 2002 Kerans CD. McKnight = Guadalupian 1 & 2 (middle SADR1 and middle SADR2) in 2002 Kerans CD. Includes McKnight Shale that is probably middle SADR1 equivalent. Ward sees no major karst event at top of McKnight. Intermediate = Guadalupian 3 & 4 (upper SADR1 & upper SADR 2) in 2002 Kerans CD. Brushy Canyon Bypass Surface = top Intermediate. Brushy Canyon = Guadalupian 5, 6 & 7 (BR 1, 2 & 3). Judkins = Guadalupian 8 (upper SADR3) in 2002 Kerans CD. Major karst surface at top. Post Judkins = Guadalupian 9 (upper SADR4) in 2002 Kerans CD. Major karst surface, base is Lovington Sand. Could be called Lovington Interval or Lovington Equivalent.
 in 2002 Kerans CD. Includes McKnight Shale that is probably middle SADR1 equivalent. Ward sees no major karst event at top of McKnight. Intermediate = Guadalupian 3 & 4 (upper SADR1 & upper SADR 2) in 2002 Kerans CD. Brushy Canyon Bypass Surface = top Intermediate. Brushy Canyon = Guadalupian 5, 6 & 7 (BR 1, 2 & 3). Judkins = Guadalupian 8 (upper SADR3) in 2002 Kerans CD. Major karst surface at top. Post Judkins = Guadalupian 9 (upper SADR4) in 2002 Kerans CD. Major karst surface, base is Lovington Sand. Could be called Lovington Interval or Lovington Equivalent.")
4
Lower San Andres Kerans Trentham Ward Guad 2 middle SADR 2 McKnight
McKnight P - 6 lower Pay Zones in Howard - Glasscock, Iatan, Diamond M, etc Guad 1 middle SADR 1 McKnight Shale P - 7 Leon 8 lower SADR 2 Holt P - 8 SADR Leon 7 lower SADR 1 Leon 6 Glorieta 1 Glorieta San Angelo Lower San Andres

7
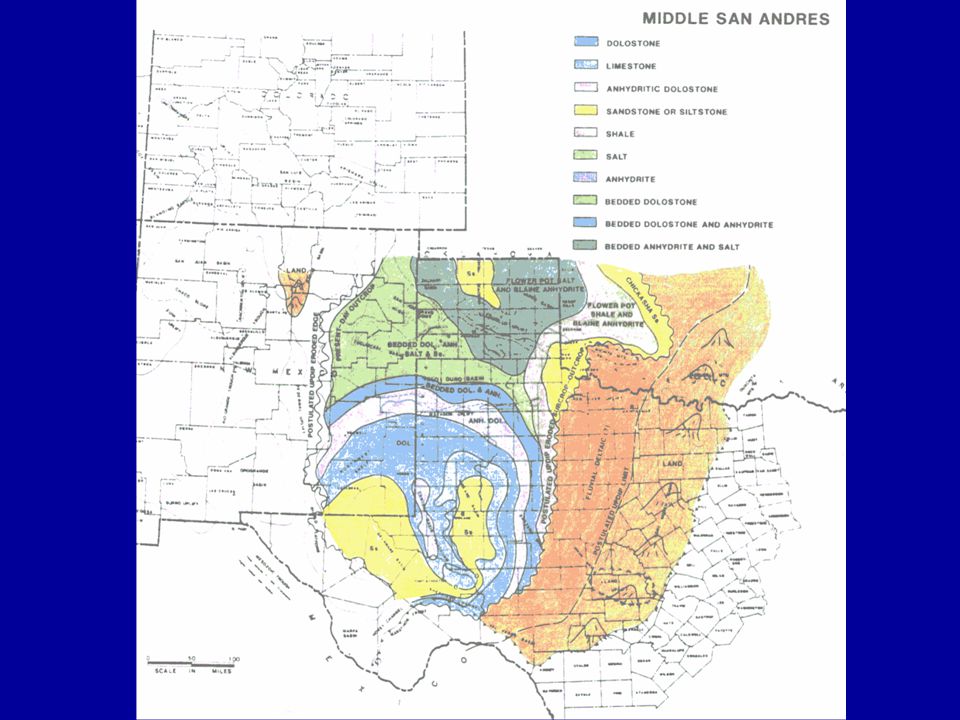
Middle San Andres Judkins Intermediate Guad 8 upper SADR 3 BR 4
Pi Marker P P P-3 Slaughter Cedar Lake, Welch, Moore, & SADR prod in Reagan Co. Guad 7 BR 3 Guad 6 BR 2 Guad 5 BR 1 Guad 4 upper SADR 2 Intermediate P - 4 Guad 3 upper SADR 1 P – 5 Middle San Andres

10
Central Basin Platform
Kerans(2001) Trentham/Ward (2002) Northwest Shelf Eastern Shelf Guadalupe Mts., NW Shelf Del Basin Central Basin Platform NM TX NE Midland Basin Guad 10 GRBG 1 CC 2 lower GRBG Premier Sand Guad 9 upper SADR 4 CC 1 Post Judkins Upper SADR Evaporitic Facies Non-deposited or Eroded Lovington Sand Upper San Andres
 Trentham/Ward (2002) Northwest Shelf. Eastern Shelf. Guadalupe Mts., NW Shelf. Del. Basin. Central Basin Platform. NM. TX. NE Midland Basin. Guad 10. GRBG 1. CC 2. lower GRBG. Premier Sand. Guad 9. upper SADR 4. CC 1. Post Judkins. Upper SADR. Evaporitic Facies. Non-deposited or Eroded. Lovington Sand. Upper San Andres.")
13
The paradigm has been that all San Andres reservoirs on the Central Basin Platform “flood the same” and produce from the same rocks.

14
San Andres Structural History
The San Andres on the platform has had a complex history including multiple karsting (Low Stand) events. The model for San Andres deposition on the platform are the Guadalupe Mountain outcrops which were deposited in a tectonically passive environment. However…..There is an middle to upper San Andres uplift of the southern end of the Central Basin Platform that is NOT seen in the Guadalupe Mts. The San Andres varies from +/-600‘ to >1600’ on the platform both as a result of thickening toward the platform margins and thinning over pre-existing structures.
 events. The model for San Andres deposition on the platform are the Guadalupe Mountain outcrops which were deposited in a tectonically passive environment. However…..There is an middle to upper San Andres uplift of the southern end of the Central Basin Platform that is NOT seen in the Guadalupe Mts. The San Andres varies from +/-600‘ to >1600’ on the platform both as a result of thickening toward the platform margins and thinning over pre-existing structures.")
15
This Leads To: In the southern portion of Crane Co. there are coal beds and reworked coals in the middle and upper San Andres. The Penwell, Jordan, Waddell and Keystone Fields produce from upper San Andres on the flanks and middle San Andres on the crest of the structures. McKnight (lower SADR) production, a major producing horizon in Sand Hills Field, may have been by passed in a number of fields.
 production, a major producing horizon in Sand Hills Field, may have been by passed in a number of fields.")
16
San Andres Sub-Provinces
Uplift – Ft Stockton Uplift portion of CBP. Mostly in Pecos Co to 1000’ SADR. Spine – north to south axis of CBP. Extends thru W. Crane, W. Ector, E. Ward, E. Winkler, W. Andrews, and E. Lea Counties. 800 – 1200’ SADR Outboard - Eastern and Western margins of CBP, Crane, Ectro, Andres, Gaines, Ward, Winkler and Lea Counties North and Northwest Shelves -. Northern Midland Basin Rim and Northwest Shelf of Delaware Basin to 1500’ SADR. Better analogs to Guadalupe Mts. Ozona Arch - More deeply eroded than CBP. Possibly nearer to source of tectonism. 600 to 1100’ SADR. Eastern Shelf – 0 to 800’. Close to source of tectonism. Midland Basin – Mix of clastics and carbonates.

17
San Andres Sub-provinces

19
I 20 CROSS SECTION H.S.A. JANELL PENWELL FOSTER LOVINGTON 243 E E E 250 JUDKINS 340 275 E 237 338 INTERMEDIATE 235 236 255 McKNIGHT (+ Holt) 480 435 312 663 TOTAL 1306 1032 785 1506
 TOTAL")
20
San Andres Factoids If >900’ Lovington may be present.
@ ~~ 900’, Judkins, no Lovington. If <600’, no Judkins. Contour maps of GRBG and SADR production is from wells IP’d prior to The assumption is that these are natural, acid or nitro completions with no fracs. The San Andres in the Foster area is +/- 1500’ thick. In the Penwell area, 15 miles to the southwest, the SADR is only ~800’ thick. The “boomer wells” (>10,000 BOPD) on the east flank of the McElroy Field are from karsted upper SADR.
 on the east flank of the McElroy Field are from karsted upper SADR.")
22
B Emma Embar E. Goldsmith Andector C B Goldsmith B TXL Lawson Donnelly
N. & W. Goldsmith E. Goldsmith Andector C B C D C B Goldsmith C B TXL C D D Lawson Donnelly D D A 5,000 – 10,000 BOPD B 1,000 – 5,000 BOPD B C 500 – 1,000 BOPD Harper Foster S Cowden D 250 – 500 BOPD Penwelll B Jordan B Waddell A

23
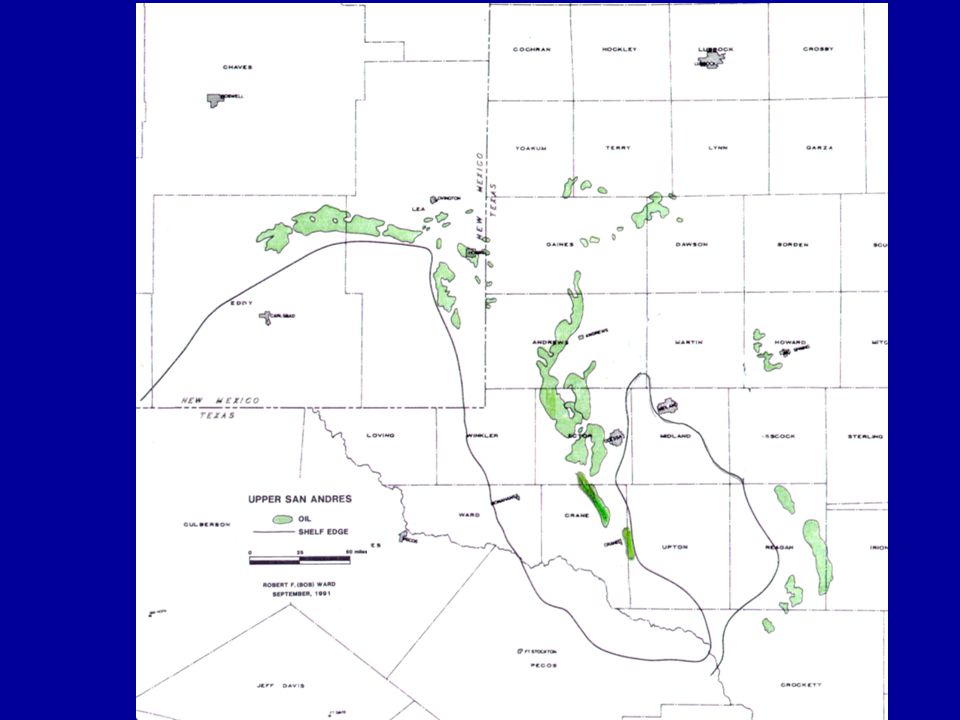
San Andres production in Red overlain on Isopach
Note northwest to southeast trend of both isopach and production. Note relationship between isopach thins and production Western boundary of production is controlled by updip permeability barrier

24
Work to Date 7 cores 2 in Sand Hills; 2 in North Ward Estes; 3 in Foster-South Cowden Cross section network in Crane Co. Correlation of 100 wells in North Ward Estes area

25
Ector County San Andres Project
Correlate units within the San Andres in Ector County. Create Cross section grid. Delineate San Andres production by unit. Evaluate depositional history and diagenetic overprint of the San Andres. Generate isopach and structure maps of each San Andres unit.

26
Needed Resources Digital Data – logs, bases, Scout info, seismic
Rock Data – Cores, samples from selected wells Funding

Similar presentations


, Ector County, Texas DE-FC22-93BC14982.>")
 with CO 2 Enhanced Oil Recovery (EOR) in Western North Dakota Zhengwen Zeng and Peng Pei Department of Geology and.>")
