Download presentation
Presentation is loading. Please wait.

1
Lecture 2 Summarizing the Sample

2
WARNING: Today’s lecture may bore some of you… It’s (sort of) not my fault…I’m required to teach you about what we’re going to cover today.
 not my fault…I’m required to teach you about what we’re going to cover today.")
3
I’ll try to make it as exciting as possible… But you’re more than welcome to fall asleep if you feel like this stuff is too easy

4
Lecture Summary Once we obtained our sample, we would like to summarize it. Depending on the type of the data (numerical or categorical) and the dimension (univariate, paired, etc.), there are different methods of summarizing the data. – Numerical data have two subtypes: discrete or continuous – Categorical data have two subtypes: nominal or ordinal Graphical summaries: – Histograms: Visual summary of the sample distribution – Quantile-Quantile Plot: Compare the sample to a known distribution – Scatterplot: Compare two pairs of points in X/Y axis.
 and the dimension (univariate, paired, etc.), there are different methods of summarizing the data. – Numerical data have two subtypes: discrete or continuous – Categorical data have two subtypes: nominal or ordinal Graphical summaries: – Histograms: Visual summary of the sample distribution – Quantile-Quantile Plot: Compare the sample to a known distribution – Scatterplot: Compare two pairs of points in X/Y axis..")
5
Three Steps to Summarize Data 1.Classify sample into different type 2.Depending on the type, use appropriate numerical summaries 3.Depending on the type, use appropriate visual summaries

6
Data Classification

7
Data Types For each dimension… Numerical ContinuousDiscrete Categorical NominalOrdinal

8
Summaries for numerical data Center/location: measures the “center” of the data – Examples: sample mean and sample median Spread/Dispersion: measures the “spread” or “fatness” of the data – Examples: sample variance, interquartile range Order/Rank: measures the ordering/ranking of the data – Examples: order statistics and sample quantiles

9
SummaryType of Sample FormulaNotes Continuous Summarizes the “center” of the data Sensitive to outliers Continuous Summarizes the “spread” of the data Outliers may inflate this value Continuousi th largest value of the sample Summarizes the order/rank of the data Continuous Summarizes the “center” of the data Robust to outliers Continuous Summarizes the order/rank of the data Robust to outliers Sample Interquartile Range (Sample IQR) Continuous Summarizes the “spread” of the data Robust to outliers
 Continuous Summarizes the spread of the data Robust to outliers")
10
Multivariate numerical data Each dimension in multivariate data is univariate and hence, we can use the numerical summaries from univariate data (e.g. sample mean, sample variance) However, to study two measurements and their relationship, there are numerical summaries to analyze it Sample Correlation and Sample Covariance
 However, to study two measurements and their relationship, there are numerical summaries to analyze it Sample Correlation and Sample Covariance.")
11
Sample Correlation and Covariance

13
How about categorical data?

14
Summaries for categorical data Frequency/Counts: how frequent is one category Generally use tables to count the frequency or proportions from the total Example: Stat 431 class composition a UndergradGraduateStaff Counts1712 Proportions0.850.050.1

15
Are there visual summaries of the data? Histograms, boxplots, scatterplots, and QQ plots

16
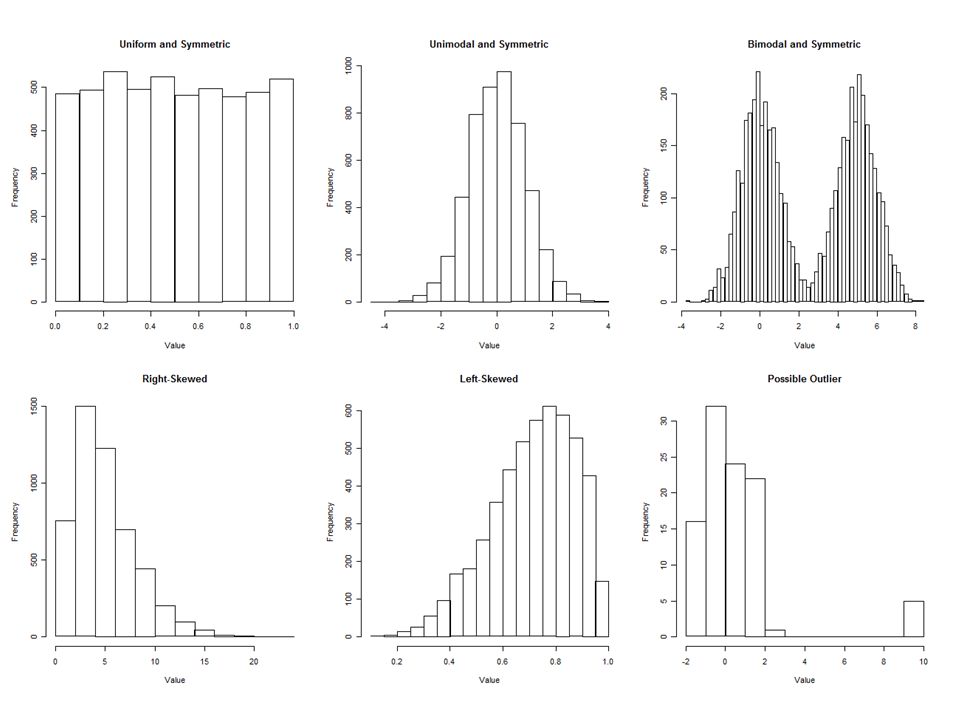
Histograms For numerical data A method to show the “shape” of the data by tallying frequencies of the measurements in the sample Characteristics to look for: – Modality: Uniform, unimodal, bimodal, etc. – Skew: Symmetric (no skew), right/positive-skewed, left/negative-skewed distributions – Quantiles: Fat tails/skinny tails – Outliers
, right/positive-skewed, left/negative-skewed distributions – Quantiles: Fat tails/skinny tails – Outliers.")
19
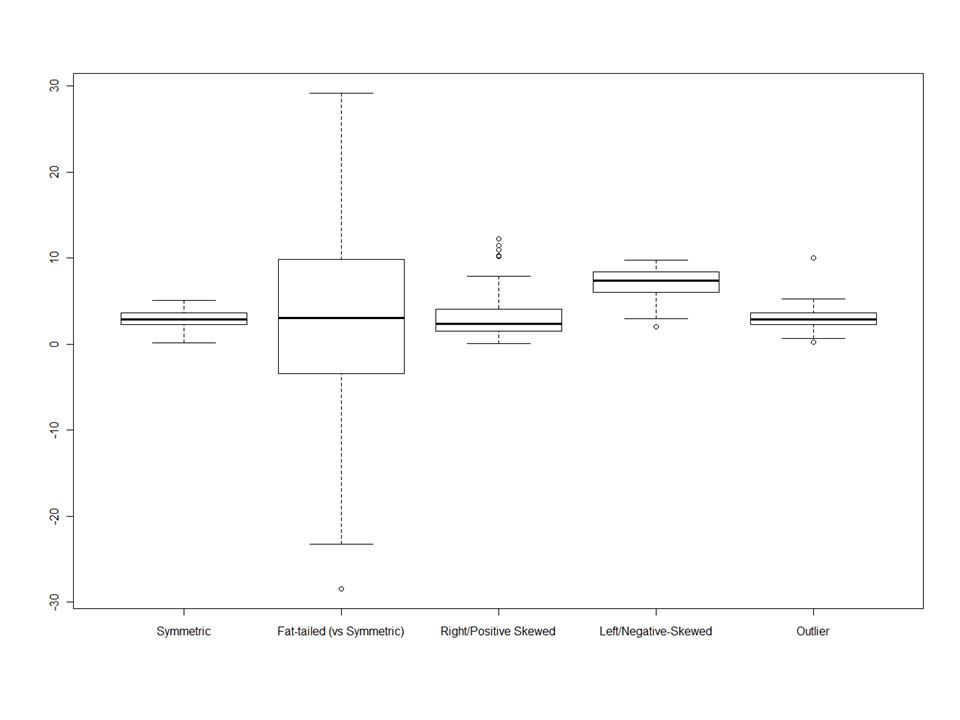
Boxplots For numerical data Another way to visualize the “shape” of the data. Can identify… – Symmetric, right/positive-skewed, and left/negative- skewed distributions – Fat tails/skinny tails – Outliers However, boxplots cannot identify modes (e.g. unimodal, bimodal, etc.)
.")
22
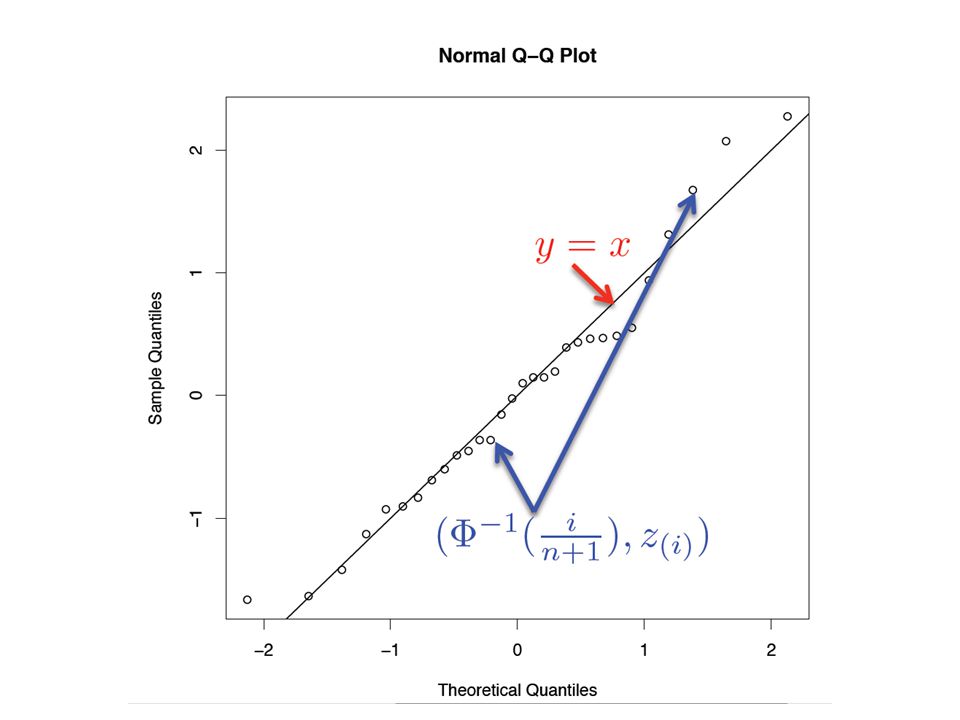
Quantile-Quantile Plots (QQ Plots) For numerical data: visually compare collected data with a known distribution Most common one is the Normal QQ plots – We check to see whether the sample follows a normal distribution – This is a common assumption in statistical inference that your sample comes from a normal distribution Summary: If your scatterplot “hugs” the line, there is good reason to believe that your data follows the said distribution.
 For numerical data: visually compare collected data with a known distribution Most common one is the Normal QQ plots – We check to see whether the sample follows a normal distribution – This is a common assumption in statistical inference that your sample comes from a normal distribution Summary: If your scatterplot hugs the line, there is good reason to believe that your data follows the said distribution.")
24
Making a Normal QQ plot

25
If your data is not normal… You can perform transformations to make it look normal For right/positively-skewed data: Log/square root For left/negatively-skewed data: exponential/square

27
Comparing the three visual techniques Histograms Advantages: – With properly-sized bins, histograms can summarize any shape of the data (modes, skew, quantiles, outliers) Disadvantages: – Difficult to compare side- by-side (takes up too much space in a plot) – Depending on the size of the bins, interpretation may be different Boxplots Advantages: – Don’t have to tweak with “graphical” parameters (i.e. bin size in histograms) – Summarize skew, quantiles, and outliers – Can compare several measurements side-by- side Disadvantages: – Cannot distinguish modes! Advantages: – Can identify whether the data came from a certain distribution – Don’t have to tweak with “graphical” parameters (i.e. bin size in histograms) – Summarize quantiles Disadvantages: – Difficult to compare side-by-side – Difficult to distinguish skews, modes, and outliers QQ Plots
 – Summarize skew, quantiles, and outliers – Can compare several measurements side-by- side Disadvantages: – Cannot distinguish modes. Advantages: – Can identify whether the data came from a certain distribution – Don’t have to tweak with graphical parameters (i.e. bin size in histograms) – Summarize quantiles Disadvantages: – Difficult to compare side-by-side – Difficult to distinguish skews, modes, and outliers QQ Plots.")
28
Scatterplots

29
Lecture Summary Once we obtain a sample, we want to summarize it. There are numerical and visual summaries – Numerical summaries depend on the data type (numerical or categorical) – Graphical summaries discussed here are mostly designed for numerical data We can also look at multidimensional data and examine the relationship between two measurement – E.g. sample correlation and scatterplots
 – Graphical summaries discussed here are mostly designed for numerical data We can also look at multidimensional data and examine the relationship between two measurement – E.g. sample correlation and scatterplots.")
30
Extra Slides

31
Why does the QQ plot work?

32
Linear Interpolation in Sample Quantiles

Similar presentations