Download presentation
Presentation is loading. Please wait.

1
April, 7th 2011

2
Population : 4.1 millions; 2.5 WB and 1.6 Gaza Median age at marriage 19 in WB, 18 in Gaza. 1 Since start of ‘intifada’ 2000, increasing poverty, unemployment and hardship. In 2002, 58% of households in WB and 54% in Gaza have lost over half their usual income since before the Intifada. 2 Dietary intake deteriorated both in terms of quantity and quality, 50% completely dependent on food aid. 3 Since 2002, construction of Annexation Wall, further restrictions on freedom of movement, worsening economic conditions that seriously compromised household welfare and access to care (42% WB, 32% Gaza) 4 1 PCBS. Population, Housing and Establishment Census, 2007. 2008. 2 World Bank 2002 3 Alquds University 2004 4: PCBS 2003
 4 1 PCBS. Population, Housing and Establishment Census, World Bank Alquds University : PCBS")
3
In 2009, 57% below poverty line, 24% in deep poverty, 25% unemployed 1 38% Palestinian population are food insecure. Land confiscation and destruction of crops contributes to food insecurity. 2 Food insufficiency is a serious problem affecting children’s ability to learn. 3 1 PCBS 2004. ON the Eve of the International Population Day 2 FAO/WFP, 2009. Occupied Palestinian Territory. Food Security and Vulnerability Analysis Report. 3 Wesness K, et.al. Appetite, 41 (3):329-31.2003
:")
4
In 2003, 38% children<5 anemic, 1 while 58% of refugees 6-36 months were anemic 2 Rate of stunting in children <5 years has risen from 7% in 1996 to 10% in 2006. 3 In 2005, a study 4 was carried out among 366 children 3-7y living in Hebron and Gaza, 15-20% anemia, 25-40% low serum ferritin 50% B12 deficiency, 25-30% Zinc deficiency 1 PCBS, Nutrition Survey 2003 2: MOH 2004 3 PCBS. Population, Housing and Establishment Census, 2007. 2008. 4 Allen Lindsay. Nutritional Status in Gaza city and Hebron. USDA, ARS Western Human Nutrition Research Center. University of California, Davis.

5
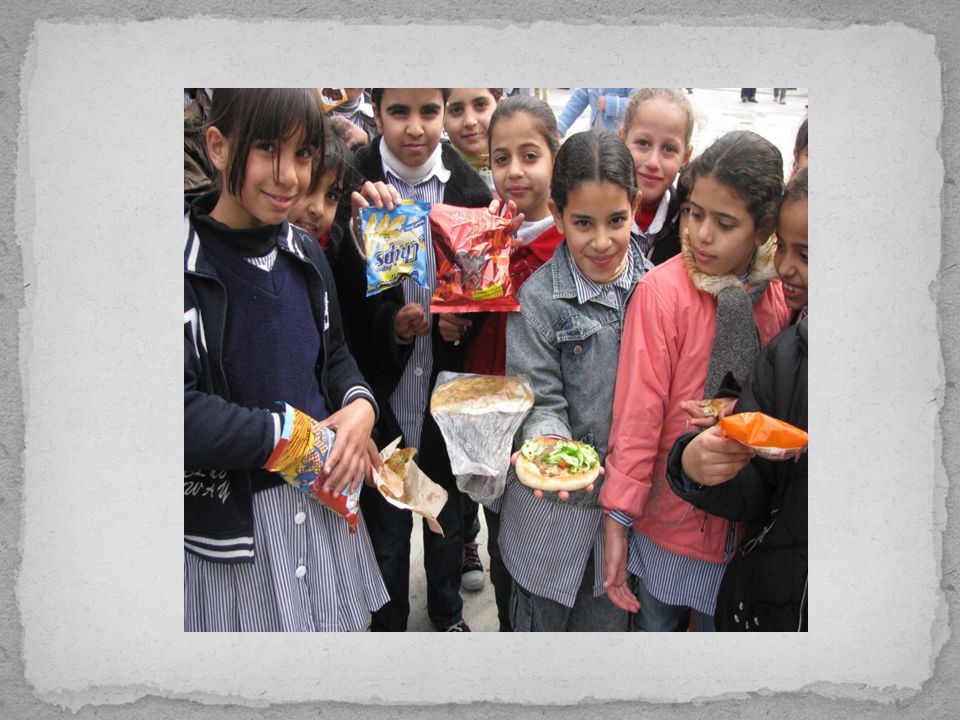
Rising in obesity, diabetes and cardiovascular disease. 1 Absence of a national school meal program Absence of systematic nutritional education at the schools Poor nutritional value of the food offered by most school cafeterias 2 Huseine et.al. Lancet 2009.

7
This research was carried out in 2009 by UNRWA, in collaboration with: Juzoor Foundation for Health & Social Development Columbia University Ministry of Higher Education/School Health Division.

8
Provide a picture of nutritional status in sample of school children in West Bank Examine factors contributing to anemia among school children. Help assess the impact of the health/nutritional interventions that are running in Palestinian communities. Identify key blood and biochemical parameters to incorporate in a surveillance system. Offer evidence-base information to direct policies and nutritional interventions.

9
School-based cross- sectional survey 2009. 22 UNRWA and Government schools covering the North, Central and South regions of the West Bank 42 students randomly selected from each of 1st, 6th, and 9th grades. 1485 students: 50% female.

10
The study was introduced at information sessions for the school community (teachers, parents, and students), held with participation of local community physicians. Informed consent and assent forms were obtained from students, parents and teachers following Columbia University guidelines.

11
Anthropometric measures Venous blood sample. Complete blood cell count C-Reactive Protein (CRP) Ferritin and Serum Zinc Serum vitamin B12 and folate Thyroid Hormones: FT3, FT4, TSH Blood lead level in 50% of sample.
 Ferritin and Serum Zinc Serum vitamin B12 and folate Thyroid Hormones: FT3, FT4, TSH Blood lead level in 50% of sample..")
12
Field manager took the standing height and weight for all participants to avoid inter-observer bias. Measurements taken twice. If difference between the 2 measurements >10%, a third measurement was taken. Central lab ran all the tests. Standardized methods, and using external validity through CDC, in addition to internal validation methods.

15
Blood: 1475/1500 (98% ), Surveys: (Student): 99% (Parent): 84% (Teacher): 100%
, Surveys: (Student): 99% (Parent): 84% (Teacher): 100%")
16
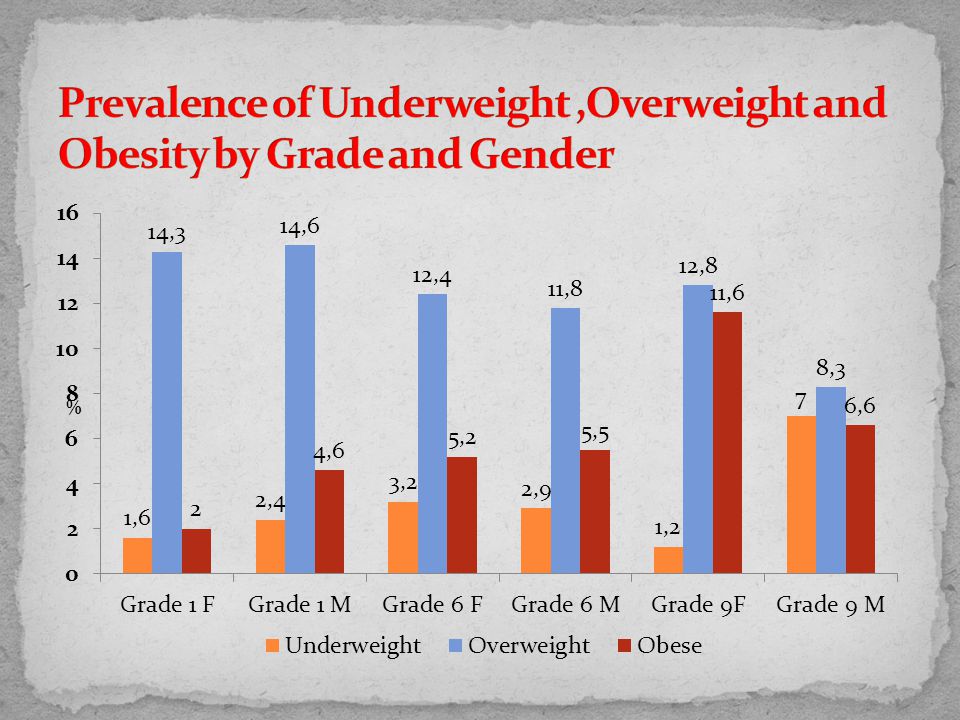
3.3% of the study sample were underweight, 12.4% were overweight and 5.9% were obese.

18
Factors associated with underweight were male gender (OR =2.8, 95% (CI): 1.5, 5.3), mother’s unemployment (OR=3.0, 95% C 1.04-8.38) and household did not have enough food at least 2 days in the past month (OR=1.8, 95% CI: 1, 3.3).
: 1.5, 5.3), mother’s unemployment (OR=3.0, 95% C ) and household did not have enough food at least 2 days in the past month (OR=1.8, 95% CI: 1, 3.3).")
21
Factors associated with obesity were child grade; higher grades were more likely to be obese (p=0.01), and watching more television was associated with a higher likelihood of obesity (p=0.02). Combining overweight and obesity, the only significant factor associated with both was sports; more days/week the students engaged in sports, the less likely they were to be overweight or obese (p=0.02).
..")
22
Mean HAZ (SD): -0.57 (1.03) 6.7% of the study sample were stunted (HAZ<-2) Insignificant gender differences: 6.5% males, 6.9% females Insignificant grade differences: 6.6% First, 8.0% Sixth, 5.5% Ninth
: (1.03) 6.7% of the study sample were stunted (HAZ<-2) Insignificant gender differences: 6.5% males, 6.9% females Insignificant grade differences: 6.6% First, 8.0% Sixth, 5.5% Ninth")
23
The only factor associated with HAZ was the hunger index which was negatively associated with HAZ (p= 0.018). Items hunger index: ran out of money to buy food, relied on a limited number of foods, cut the size of meals or skip any, ate less because there was not enough money for food, children ate less than they should because as there was not enough money for food, children complained of hunger, cut the size of the children’s meals or skipped meals, the children went to bed hungry at least once.

24
3.3% of the study sample were underweight, 12.4% were overweight and 5.9% were obese. 6.7% of the study sample were stunted Main nutritional problems in all grades and in both males and females were overweight and obesity. Stunting, overweight and obesity coexist in first and sixth graders. Stunting and underweight coexist with overweight and obesity in ninth grade males

25
Source: WHO 2001 (WHO/NHD/01.3) Serum ferritin cut point 15 ng/ml Low MCV cut point 75 GenderAge (years)Hb (g/dl) Both5-1211.5 Both12-1512 Females>= 1512 Males>= 1513
 Serum ferritin cut point 15 ng/ml Low MCV cut point 75 GenderAge (years)Hb (g/dl) Both Both Females>= 1512 Males>= 1513")
26
Prevalence of anemia 9.4% Significant gender differences : 12.1% Females, 7.1% Males (p=0.001) Insignificant differences by grade level: First: 8.9% Sixth: 8.0% Ninth: 12.1% The Anemia among male schoolchildren was 27.8% (8.6% in WB and 55.3% in GS) (Nutrition survey 2011, MOH).
 Insignificant differences by grade level: First: 8.9% Sixth: 8.0% Ninth: 12.1% The Anemia among male schoolchildren was 27.8% (8.6% in WB and 55.3% in GS) (Nutrition survey 2011, MOH).")
27
Prevalence of ID 22.7% Significant gender differences : 29.5% Females, 15.7% Males (p=0.00) Significant differences by grade level: First: 19.7% Sixth: 18.7% Ninth: 29.9% (p=0.00)
 Significant differences by grade level: First: 19.7% Sixth: 18.7% Ninth: 29.9% (p=0.00)")
29
9.4% of the study sample were anemic. 42.0% of those with anemia had low serum ferritin (< 15 µg/L) 18.8% of the sample had low MCV (< 75FL) 22.7% had low serum ferritin ( 11 mg/L). 2.6% of the entire sample had elevated CRP
 18.8% of the sample had low MCV (< 75FL) 22.7% had low serum ferritin ( 11 mg/L). 2.6% of the entire sample had elevated CRP.")
30
31.3% of the study sample had Zinc deficiency Significant gender differences: 29.1% Males, 33.5% Females (p=0.04) Significant age differences in Zinc deficiency: First grade: 35.2% Sixth grade: 32.9% Ninth grade: 25.6% (p=0.003)
 Significant age differences in Zinc deficiency: First grade: 35.2% Sixth grade: 32.9% Ninth grade: 25.6% (p=0.003)")
31
22% children have vitamin B12 deficiency and 40% more show a marginal status Significant gender differences in B12 deficiency: 24.0% Males, 20.1% Females (p=0.04) Significant grade differences: First: 14.7% Sixth: 24.3% Ninth: 27.4% (p=0.00)
 Significant grade differences: First: 14.7% Sixth: 24.3% Ninth: 27.4% (p=0.00)")
33
0.1% : <3.1 µg/L (Megaloblastic anemia) 2.3% : <7.0 µg/L (NTD’s risk) 72.3%: 7-20 µg/L (Normal) 25.1% : >20 µg/L (Supra-physiological)
 2.3% : <7.0 µg/L (NTD’s risk) 72.3%: 7-20 µg/L (Normal) 25.1% : >20 µg/L (Supra-physiological)")
34
Insignificant gender differences: 3.0% Females, 1.8% Males Significant grade differences: First : 1.4% Sixth: 1.4% Ninth: 4.4% (p=0.002)
")
36
Thyroid Hormones: 0.2% had low FT3 (FT3< 2.3 pg/mL) 8.2% had low FT4 (FT4< 0.89 ng/dL) 3.6% had high TSH (TSH> 5.5 uIU/mL)
 8.2% had low FT4 (FT4< 0.89 ng/dL) 3.6% had high TSH (TSH> 5.5 uIU/mL)")
37
There were no cases of lead toxicity in the studied sample.

38
Children start school with low obesity but by the 9 th grade overweight and obesity ( 24% ) start to be observed, mainly in women. Although overweight and obesity are more widespread problem than stunting and underweight, under-nutrition is an urgent health priority. Anemia is mild in school-age children of the West Bank, although prevalence increases in women after the 6 th grade. Half of the anemia is explained as iron deficiency.

39
Although anemia prevalence is low, ID continues affecting around 20% of the studied population. 30% children present low serum zinc levels 22% children have vitamin B12 deficiency and 40% more show a marginal status. Based on logistic regression, factors associated with anemia were female gender (OR: 1.6 (1.1, 2.2), ID (OR: 2.5 (1.7,3.6), and Low Zinc (OR: 1.6 (1.1, 2.2). *B12 deficiency was not associated with anemia in our sample.
, ID (OR: 2.5 (1.7,3.6), and Low Zinc (OR: 1.6 (1.1, 2.2). *B12 deficiency was not associated with anemia in our sample..")
40
25% children show supra-physiological levels of serum folate, which suggest a plausible association with intake of fortified wheat flour. Levels of thyroid hormones point out that iodine deficiency is under control in the West Bank (91% iodized salt )1. Lead contamination was not identified in the studied population. While deficiencies of iron, zinc and vitamin B-12; folate intake is in the high side; and iodine status is fine. 1 PCBS 2011
1. Lead contamination was not identified in the studied population. While deficiencies of iron, zinc and vitamin B-12; folate intake is in the high side; and iodine status is fine. 1 PCBS")
41
In summary, current situation points out that the main nutritional risks for school-age children in the West Bank are overweight and obesity, combined The results suggest that salt iodization and wheat flour fortification are influencing the micronutrient status of the Palestinian population. However, some micronutrients are still required in larger amounts (iron, zinc, vitamin B-12, e.g.), either by increasing the fortification levels or by using complementary measures combined with health education.
, either by increasing the fortification levels or by using complementary measures combined with health education..")
42
Salwa Massad 1 Umaiyeh Khammash 2 Richard J. Deckelbaum 3 Mysoon Obeidi 2 Paula Bordelois 3 Steve Holleran 3 Consultants Omar Dary 4 Medhin-Mahari 5 1: Juzoor Foundation for Health and Social Development 2: UNRWA 3: Institute of Human Nutrition/Columbia University 4: A2Z/the USAID Micronutrient Project, Washington, DC, USA 5. Department of Women's and Children's Health, Pediatrics, Uppsala University

43
We are grateful for all participants, school health officers and school principles and field workers. Grateful for UNRWA Chief Education Officer and Director of School Health Division/MOHE for all their help and support This study was supported by UNRWA, UNICEF, Juzoor and Palestinian Health Sector Reform and Development Project (the Flagship project)
.")
Similar presentations


 & Abdulkadir Egal PhD (PH)>")
 Jamai-Osmania (P.O.), Hyderabad.>")


