Download presentation
Presentation is loading. Please wait.

2
INTRODUCTION LINER SERVICES SHARE OF CONTAINARISATION The share of containerized trade, as part of the world’s total dry cargo, increased from 5.1 per cent in 1980 to 24.3 per cent in 2009 The world fleet of container ships increased by 7.1 million dwt in 2009, by just over 4 per cent, to reach 169 million dwt, which is approximately 13.3 per cent of the total world fleet.

3
DEVELOPMENTS OF LINER TRADE There has been an increase in the number of container ships delivered over the last few years, in the expectation that world trade would also grow. However, the amount of cargo needing to be transported has dropped, owing to the global economic crisis. Over the course of 2009, several shipping lines cut the size of their fleet by returning unwanted chartered tonnage to shipowners, sending some ships to demolition, and laying up others. In June 2009, Evergreen Line was reported to have planned the scrapping of 31 vessels with a capacity of between 2,728 and 3,428 TEUs. By November 2009, the total number of vessels lying idle for more than 20 days was reported at 551, with a combined capacity of 1.18 million TEUs. Those vessels that carriers could not get rid of were added to existing liner services, and all ships were made to sail at lower speeds to absorb capacity. All of these measures together helped to stabilize freight rates.

4
CONTAINER FRIGHT RATES German shipowners dominate global liner capacity,with Hamburg brokers controlling about 75 per cent of the container ship charter tonnage. Their ships, in many cases, are chartered by the large liner companies, which, together with their own fleets of vessels, operate an extended service (see chapter two for more details on liner shipping companies). For example, CMA CGM’s fleet consisted of about 67 per cent chartered-in tonnage in 2009, and APL’s percentage was 71 per cent, while the average for the top 20 liner companies in 2009 was around 48.5 per cent. Since 1998, the Hamburg Shipbrokers’ Association (VHSS) has published the Hamburg Index, which provides a market analysis of container ship time charter rates of a minimum duration of three months.
. For example, CMA CGM’s fleet consisted of about 67 per cent chartered-in tonnage in 2009, and APL’s percentage was 71 per cent, while the average for the top 20 liner companies in 2009 was around 48.5 per cent. Since 1998, the Hamburg Shipbrokers’ Association (VHSS) has published the Hamburg Index, which provides a market analysis of container ship time charter rates of a minimum duration of three months..")
6
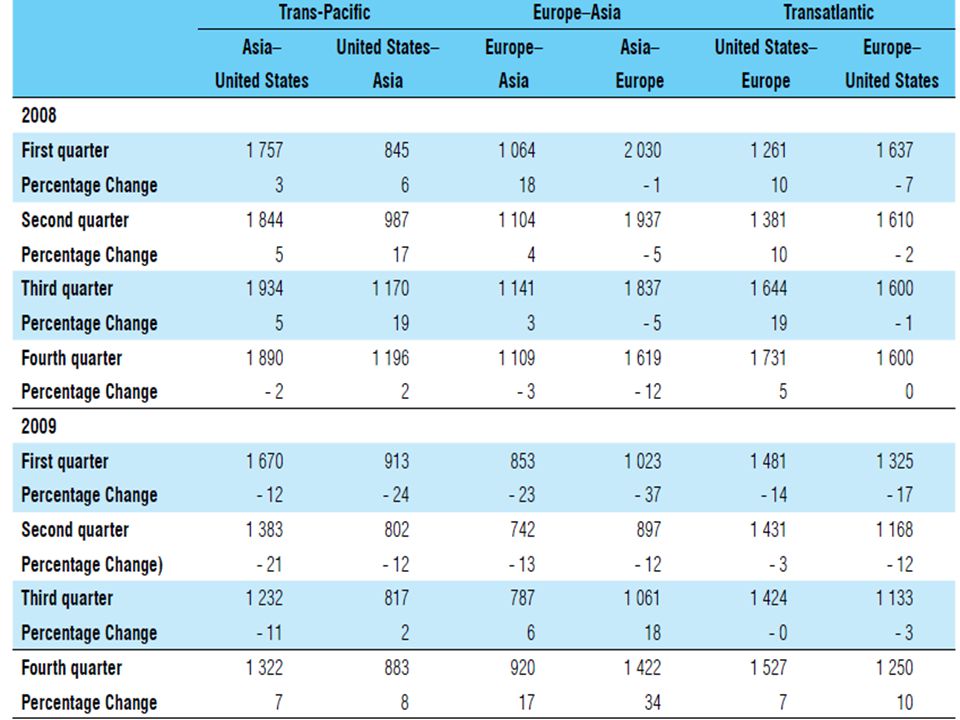
FRIGHT RATE ON MAIN ROOTS In 2009, freight rates continued a downward path that had begun in the fourth quarter of 2008. In early 2009, some container shipping lines lowered their Asia–Europe freight rates to zero and shippers paid only surcharges as a contribution to the carriers’ operating costs. An improvement was first seen on the Asia–Europe route in the third quarter of 2009, and then on the other routes in the last quarter. Figures published by the European Liner Affairs Association show that container volumes on the Asia–Europe trade fell by around 14.8 per cent over the course of 2009. A year-on-year comparison between 2009 and 2008 shows that for each quarter rates were lower, except for United States–Asia in the first quarter and United States–Europe in the first half. In fact, the United States–Europe route proved to be the sturdiest over 2009, while rates from Asia to the United States suffered the biggest falls. Liner shippers attempted to push freight rates up, by slow steaming and by laying up vessels. The sailing time from some northern European ports to Asia increased to a record high of over 40 days. This helped push base freight rates from Asia to Europe from $600 in October 2009 to $900–$1000 by the end of the year.

Similar presentations


 Central Statistics Office Conference 2009 “Shipping,>")


 www.cscl.com.cn.>")