Download presentation
Presentation is loading. Please wait.

1
Computer Graded Visualizations John Fountain and Katherine Ryker Marine, Earth and Atmospheric Sci. GSA SE Meeting April 10, 2014

2
Development Team Katherine Ryker –Visualization Development –Class Use –Evaluation Doel Gonzalez –Database –Server –Sever/Client communication

3
Value of Visualizations Visualizations invaluable for learning in geosciences (e.g. Libarkin, 2002; McConnell et al., 2003 ) And Assessment: Student-created products invoke higher level skills, while multiple choice questions typically examines low Depth of Knowledge Skills (e.g. Yuan and Le, 2012).
 And Assessment: Student-created products invoke higher level skills, while multiple choice questions typically examines low Depth of Knowledge Skills (e.g. Yuan and Le, 2012)..")
4
Manual Grading Limits Use Although value proven, grading student- created products requires more resources, which limits use (Darling-Hammond and Adamson, 2013)
")
5
Research Objective Allow increased use of visualizations in assessment by developing an auto-scoring method. Method designed for routine use, including daily “homework” assignments

6
ICAT ( Instructional Computer Adaptive Test ) Visualization Grading added to ICAT ICAT combines instruction and assessment to enhance student mastery of material to be learned outside of class: Not Simply Assessment
 Visualization Grading added to ICAT ICAT combines instruction and assessment to enhance student mastery of material to be learned outside of class: Not Simply Assessment")
7
Three Types of Drawing Freehand drawing Polylines (connected straight segments) Insertion of symbols
 Insertion of symbols")
9
Polyline: allows precise location

11
Grading Visualizations

12
Define “Correct” Area” area

13
Up To Five Areas

14
Rubric Flexible Example: 90% of student’s line in “correct” area and 0% in “wrong” area = A Can be as complex as desired, using multiple logical statements

15
If The Answer is Wrong? If a high level question is missed, what does it mean? Usually involves synthesis of multiple knowledge areas ICAT designed to identify knowledge gaps and address them

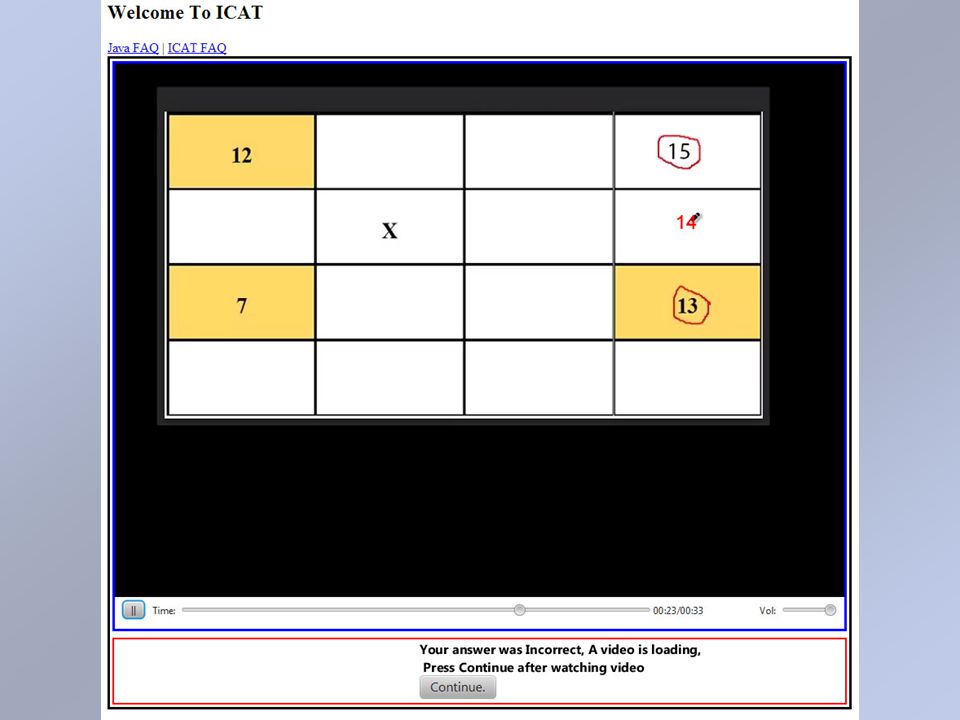
16
Instructional ICAT provides instructional material when a question is not answered correctly May be videos or text + image

19
Investigate Underlying Concepts Sub-questions investigate individual knowledge areas Instructional material directed to specific area

25
Why The Question was Missed Sub-questions can investigate individual knowledge areas underlying main question Information keyed to responses can build knowledge needed to answer questions

26
Missed Questions Repeated After a question is missed: – information may be given –Or a sub-question that investigates underlying knowledge areas Eventually the missed question will be returned to

27
Automatic Grade Book Gradebook has student grade list plus: –Master Quiz Grades –Separate Grades For Each Visualization –Evaluations of Each Question Was material learned? What was not understood? Sub-questions results show knowledge areas that were not mastered

28
Conclusion Auto-grading of visualizations implemented in ICAT Used successfully in Introductory Geology Classes Allows routine (daily) use of visualizations for assessment
 use of visualizations for assessment")
29
Thank You for Listening! Questions?? Funding from the National Science Foundation’s Opportunities for Enhancing Diversity In the Geosciences Program

Similar presentations


 Key Findings to Higher Education National Research Council MSP Workshop How People Learn June 28, 2004 Bonnie J. Brunkhorst.>")


