Download presentation
Presentation is loading. Please wait.

1
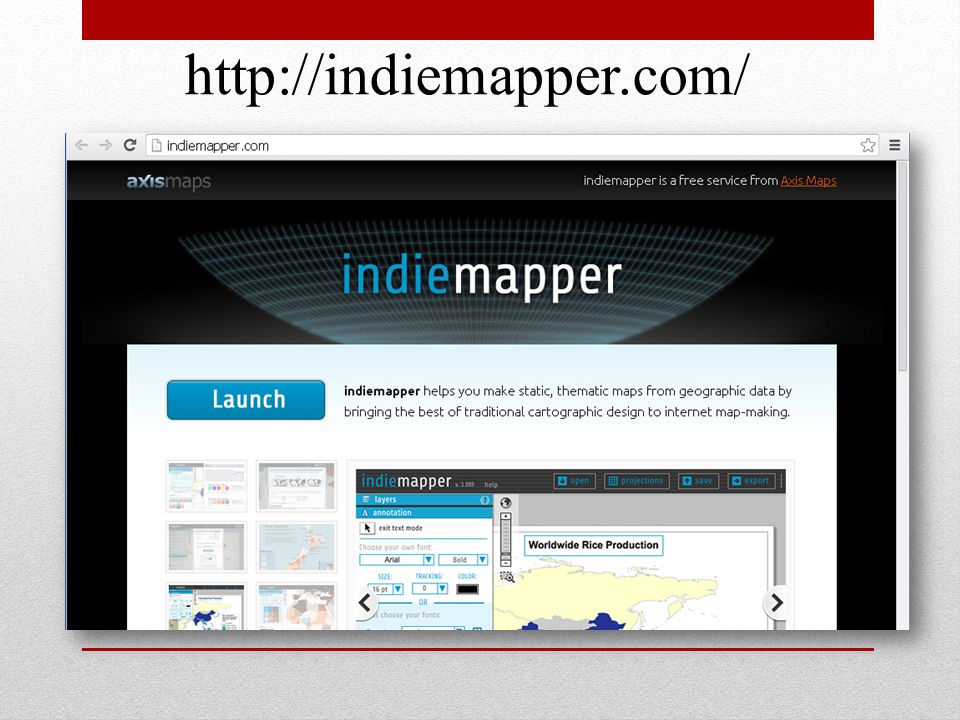
Indiemapper tools

3
Non-available offline
Why “indiemapper”? - + Easy Variety of maps/tools No registration Free English only Limited graphic tools Non-available offline

4
Historical note It was developed as a tool useful to map-makers, whether casual or professional, who may not need advanced functions of modern GIS, but do want a multitude of symbology and design options. First version was presented in 2008.

5
GIS (Geographical Information Systems) tool-kit
Indiemapper Visualise data 2D maps + 3D maps - Animations Manipulate spatially Calculate distances and adjacencies Change projections and scales Integrate disparate sources Analyse spatially Quantitative analysis Qualitative analysis

6
Libraries, shape files, own maps

7
…To download*.kml, *.shp та *.gpx files
*.shp makes life easier…

8
Each of the component files of a shapefile is limited to 2 GB each!
What is *.shp file? Nontopological format for storing the geometric location and attribute information of geographic features: .shp – form .shx – index .dbf – attribute Each of the component files of a shapefile is limited to 2 GB each!

9
Free libraries of *.shp files:
- maps for any country in the world - world political map - lots of different patterns - Africa map library

10
Graphical tools in Indiemapper

11
Projections (perspective views of the Earth)
")
12
Why projections? Projections = coordinate system.
Projection converts coordinates on the round Earth to coordinates on the flat map. Each projection has distortions. Choice of the “appropriate” projection is determined by objectives.

13
Different ways of visualization

14
Cartograms Re-sizes the global land masses according to which variable is mapped. Isolates one variable and provides a different world view.

15
Deaths due to HIV infections that progressed to AIDS – 2002
Territories are sized in proportion to the absolute number of people who died from HIV/AIDS in one year. Map credits/source: WorldMapper, Map No. 374;

16
Proportional Symbols Size of symbol is proportional to size of data value. The larger the symbol, the “more” of something exists at a certain location.

17
Map credits/source: created by K. Tummino (4/21/08), http://personal
,")
18
Choropleth When to use:
Choros (place) plethos (filled) When to use: Data are attached to enumeration units (countries, provinces) Data are standardized to show rates or ratios Never use with raw data/counts!
 plethos (filled) When to use: Data are attached to enumeration units (countries, provinces) Data are standardized to show rates or ratios. Never use with raw data/counts!")
19
Map credits/source: WHO (2011), http://gamapserver. who
, who")
20
Dot Density You can map raw data/counts! Describes density over area
1 dot = some quantity of data value one-to-one dot density maps one-to-many dot density maps You can map raw data/counts!

21
Map credits/source: Division of HIV/AIDS Prevention, National Center for HIV, STD, and TB Prevention (NCHSTP), Centers for Disease Control.
, Centers for Disease Control.")
22
Combining data sets Population of African countries and % of their population living with AIDS Map credits/source:

23
Playing with intervals
Methods to create intervals in Indiemapper: manually equal intervals (ignores data distribution; unequal number of observations in each interval) “optimal” breaks (takes into account data distribution) quartiles (top 25%, 25% above middle, 25% below middle, bottom 25%; equal number of observations are in each interval) standard deviations (mean+1s, mean-1s)
 optimal breaks (takes into account data distribution) quartiles (top 25%, 25% above middle, 25% below middle, bottom 25%; equal number of observations are in each interval) standard deviations (mean+1s, mean-1s)")
24
Export in SVG, JPEG, PNG

25
Additional instruments for efficient use of indiemapper
OpenOffice – editing of *.dbf files1 Steps: Open *.dbf file in OpenOffice. Add a new column with an indicator of interest. Save the file in the same format (*.dbf ) Inkscape – graphical tool: correction of legends, text notes etc. Export your map as an *.svg file and open it in Inkscape. Use Inkscape to improve the look of the map. 1 If you use Excel, unless you have Excel 2003 or earlier, it will not save .dbf files – you will have to export to Access first!
 Inkscape – graphical tool: correction of legends, text notes etc. Export your map as an *.svg file and open it in Inkscape. Use Inkscape to improve the look of the map. 1 If you use Excel, unless you have Excel 2003 or earlier, it will not save .dbf files – you will have to export to Access first!")
26
Missing data in *.dbf file
If table contains missing cells, *.dbf usually assigns “0” value (starting level of the 1st rank). It is common to assign “impossible” values like “-99”. So, we can use some different shading for this data. 1 If you use Excel, unless you have Excel 2003 or earlier, it will not save .dbf files – you will have to export to Access first!
. It is common to assign impossible values like So, we can use some different shading for this data. 1 If you use Excel, unless you have Excel 2003 or earlier, it will not save .dbf files – you will have to export to Access first!")
Similar presentations


 Practical exercise : «HIV prevalence and affected populations in Europe»* Based on data from European Centre for Disease Prevention and Control/WHO.>")

 Kelly Clonts Presentation for UC Berkeley, D-Lab October 29 th, 2014.>")
