Download presentation
Presentation is loading. Please wait.

1
機率分布 PROBABILITY DISTRIBUTIONS 台北醫學大學公共衛生學系 葉錦瑩 CHAPTER 4

2
兩類不同的機率分布 (Probability Distribution) The discrete type of random variable Σf(x) = 1 Pr(A) = Pr(X ⊂ A)=Σf(x) F(x) = Σf(w) The continuous type of random variable ∫f(x)dx = 1 Pr(A) = Pr(X ⊂ A) = ∫f(x)dx F(x) = ∫ f(w)dw S where : S = {x ; x =1,2,3,…} A ⊂ S x ⊂ A f(x)>0 A w≦xw≦x S A where : S = {x ; 0<x<∞} A ⊂ S x ⊂ A f(x)>0 x -∞
 The discrete type of random variable Σf(x) = 1 Pr(A) = Pr(X ⊂ A)=Σf(x) F(x) = Σf(w) The continuous type of random variable ∫f(x)dx = 1 Pr(A) = Pr(X ⊂ A) = ∫f(x)dx F(x) = ∫ f(w)dw S where : S = {x ; x =1,2,3,…} A ⊂ S x ⊂ A f(x)>0 A w≦xw≦x S A where : S = {x ; 0<x<∞} A ⊂ S x ⊂ A f(x)>0 x -∞")
3
Definition The probability distribution of a discrete random variable is a table, graph, formula, or other device used to specify all possible values of a discrete random variable along with their respective probabilities.

4
分立性機率分布 (Discrete Probability Distribution ; Mass Function) 二項母群 ( Bernoulli Population ) μ = π σ 2 = π(1 - π) 二項分布 ( Binomial Distribution ) Pr(X = x) = C x n π x (1 - π) (n-x) – 成功數 (X) : μ = nπ σ 2 = nπ(1 - π) – 成功率 (p) : μ = π σ 2 = π(1 - π) / n
 二項母群 ( Bernoulli Population ) μ = π σ 2 = π(1 - π) 二項分布 ( Binomial Distribution ) Pr(X = x) = C x n π x (1 - π) (n-x) – 成功數 (X) : μ = nπ σ 2 = nπ(1 - π) – 成功率 (p) : μ = π σ 2 = π(1 - π) / n")
5
分立性機率分布 (Discrete Probability Distribution ; Mass Function) – 波以松分布 ( Poisson Distribution ) 當 n 大但 π 小時,二項分布會趨近於此分布 Pr(X = x) = μ x e -μ /x! μ = nπ σ 2 = nπ(1 - π) ~=n π = μ – 超幾何分布 ( Hyper-geometric Distribution ) 抽樣時每次不放回,即各個試驗是不獨立的 Pr(A=a \ T1,T2,T3,T4;n) = ( T1 a )( T2 c )/( n T3 ) Pr(A = a \ T1,T2,T3,T4;n) = (T1!T2!T3!T4!)/(n! a! b! c! d!) +- + T3 - T4 T1T2n ab cd
 +- + T3 - T4 T1T2n ab cd.")
6
Table 4.2.1 shows the prevalence of prescription and nonprescription drug use in pregnancy among the study subjects. We wish to construct the probability distribution of the discrete variable X, where X is the number of prescription and non- prescription drugs used by the study subjects. 機率分佈

7
P(X = x 1 ) = P(X = 0) = 1425/4185 =.3405 機率分佈
 = P(X = 0) = 1425/4185 =.3405 機率分佈")
9
Example 4.2.2 What is the probability that a randomly selected woman will be one who used three prescription drugs? P(X = 3) =.0832 機率分佈
 =.0832 機率分佈.")
10
Example 4.2.3 What is the probability that a randomly selected woman used either one or two drugs? P(1 ∪ 2) = P(1) + P(2) =.3228 +.1895 =.5123 機率分佈
 = P(1) + P(2) =.3228 +.1895 =.5123 機率分佈.")
13
What is the probability that a woman picked at random will be one who used two or fewer drugs? Example 4.2.4 P(x ≦ 2) =.8528 機率分佈
 =.8528 機率分佈.")
14
What is the probability that a randomly selected woman will be one who used fewer than two drugs ? Example 4.2.5 P(x < 2) = P(x ≦ 1) =.6633 機率分佈
 = P(x ≦ 1) =.6633 機率分佈")
15
What is the probability that a randomly selected woman used five or more drugs ? Example 4.2.6 P(x ≧ 5) + P(x ≦ 4) = 1 P(x ≧ 5) = 1 - P(x ≦ 4) = 1 -.9733 =.0267 機率分佈
 + P(x ≦ 4) = 1 P(x ≧ 5) = 1 - P(x ≦ 4) = 1 -.9733 =.0267 機率分佈")
16
What is the probability that a randomly selected woman is one who used between three and five drugs, inclusive ? Example 4.2.7 P(x ≦ 5) =.9872 P(3 ≦ x ≦ 5) = P(x ≦ 5) - P(x ≦ 2) =.9872 -.8528 =.1344 機率分佈
 =.9872 P(3 ≦ x ≦ 5) = P(x ≦ 5) - P(x ≦ 2) =.9872 -.8528 =.1344 機率分佈")
17
We are interested in being able to compute the probability of x successes in n Bernoulli trials. For example, suppose that in a certain population 52 percent of all recorded births are males. We interpret this to mean that the probability of a recorded male birth is.52. If we randomly select five birth records from this population, what is the probability that exactly three of the records will be for male births ? Example 4.3.1 二項分佈

18
p =.52 q = 1 - p = 1 -.52 =.48 P(x=1, 0, 1, 1, 0) = pqppq = q 2 p 3 = (.48) 2 (.52) 3 P(x=3) = 10(.48) 2 (.52) 3 = 10(.2304)(.140608) =.32 NumberSequence 1212 10110 11100 310011 411010 511001 610101 701110 800111 901011 1001101 二項分佈
 = pqppq = q 2 p 3 = (.48) 2 (.52) 3 P(x=3) = 10(.48) 2 (.52) 3 = 10(.2304)( ) =.32 NumberSequence 二項分佈")
19
Definition A combination of n objects taken x at a time is an unordered subset of x of the n objects. n C x = n!/x!(n-x)! f(x) = n C x q n - x p x = n C x p x q n - x 二項分佈
. f(x) = n C x q n - x p x = n C x p x q n - x 二項分佈.")
21
Example As another example of the use of the binomial distribution, suppose that it is known that 30 percent of a certain population are immune to some disease. If a random sample of size 10 is selected from this population, what is the probability that it will contain exactly four immune persons ? f(4) = 10 C 4 (.7) 6 (.3) 4 = 10!/(4!6!)*(.117649)(.0081) =.2001 Example 4.3.2 二項分佈
 = 10 C 4 (.7) 6 (.3) 4 = 10!/(4!6!)*( )(.0081) =.2001 Example 二項分佈.")
22
Suppose it is known that in a certain population 10 percent of the population is color blind. If a random sample of 25 people is drawn from this population, use Table B in Appendix to find the probability that: –Five or fewer will be color blind. P(X ≦ 5) =.9666 –Six or more will be color blind. P(X ≧ 6) = 1 - P(X ≦ 5) = 1 -.9666 =.0334 –Between six and nine inclusive will be color blind. P(6 ≦ X ≦ 9) = P(X ≦ 9) - P(X ≦ 5) =.9999 -.9666 =.0333 –Two, three, or four will be color blind. P(2 ≦ X ≦ 4) = P(X ≦ 4) - P(X ≦ 1) =.9020 -.2712 =.6308 Example 4.3.3 二項分佈
 =.9666 –Six or more will be color blind. P(X ≧ 6) = 1 - P(X ≦ 5) = 1 -.9666 =.0334 –Between six and nine inclusive will be color blind. P(6 ≦ X ≦ 9) = P(X ≦ 9) - P(X ≦ 5) =.9999 -.9666 =.0333 –Two, three, or four will be color blind. P(2 ≦ X ≦ 4) = P(X ≦ 4) - P(X ≦ 1) =.9020 -.2712 =.6308 Example 二項分佈.")
23
Example 4.3.4 In a certain community, on a given evening someone is at home in 85 percent of the households. A health research team conducting a telephone survey selects a random sample of 12 households. Use Table B to find the probability that: –The team will find someone at home in exactly 7 households. P(X = 5\n = 12, p =.15) = P(X ≦ 5) - P(X ≦ 4) =.9954 -.9761 =.0193 –The team will find someone at home in 5 or fewer households. P(X ≦ 5\n = 12, p =.85) = P(X ≧ 12 - 5\n = 12, p =.15) = P(X ≧ 7\n = 12, p =.15) = 1 - P(X ≦ 6\n = 12, p =.15) = 1 -.9993 =.0007 –The team will find someone at home in 8 or more households. P(X ≧ 8\n = 12, p =.85) = P(X ≦ 4\n = 12, p =.15) =.9761 二項分佈
 = P(X ≦ 5) - P(X ≦ 4) =.9954 -.9761 =.0193 –The team will find someone at home in 5 or fewer households. P(X ≦ 5\n = 12, p =.85) = P(X ≧ 12 - 5\n = 12, p =.15) = P(X ≧ 7\n = 12, p =.15) = 1 - P(X ≦ 6\n = 12, p =.15) = 1 -.9993 =.0007 –The team will find someone at home in 8 or more households. P(X ≧ 8\n = 12, p =.85) = P(X ≦ 4\n = 12, p =.15) =.9761 二項分佈.")
24
5

25
Example 4.4.1 In a study of suicides, Gibbons et al. (A-4) found that the monthly distribution of adolescent suicides in Cook County, Illinois, between 1977 and 1987 closely followed a Poisson distribution with parameter λ = 2.75 = μ. Find the probability that a randomly selected month will be one in which three adolescent suicides occurred. P(X = 3) = μ x e -μ / x ! = e -2.75 2.75 3 /3! = (.063928)(20.796875) =.221584 波以松分布
 found that the monthly distribution of adolescent suicides in Cook County, Illinois, between 1977 and 1987 closely followed a Poisson distribution with parameter λ = 2.75 = μ. Find the probability that a randomly selected month will be one in which three adolescent suicides occurred. P(X = 3) = μ x e -μ / x ! = e /3. = ( )( ) = 波以松分布.")
26
Example 4.4.2 Refer to Example 4.4.1. Assume that future adolescent suicides in the studied population will follow a Poisson distribution. What is the probability that a randomly selected future month will be one in which either three or four suicides will occur ? P(X = 3) + P(X = 4) =.221584 + e -2.75 2.75 4 /4! =.221584 +.152338 =.373922 波以松分布
 + P(X = 4) = + e /4. = + = 波以松分布.")
27
Example 4.4.3 In the study of a certain aquatic organism, a large number of samples were taken from a pond, and the number of organisms in each sample was counted. The average number of organisms per sample was found to be two. Assuming that the number of organisms follows a Poisson distribution, fine the probability that the next sample taken will contain one or fewer organisms. In table C λ = 2 = μ P(X ≦ 1 \ 2) = P (X = 1) + P (X = 0) =.406 波以松分布
 = P (X = 1) + P (X = 0) =.406 波以松分布.")
28
Example 4.4.4 Refer to Example 4.4.3. The average number of organisms per sample was found to be two. Find the probability that the next sample taken will contain exactly three organisms. λ = 2 = μ P(X = 3 \ 2) = P(X = 3) + P (X = 2) + P (X = 1) + P (X = 0) = P(X ≦ 3) - P(X ≦ 2) =.857 -.677 =.180 波以松分布
 = P(X = 3) + P (X = 2) + P (X = 1) + P (X = 0) = P(X ≦ 3) - P(X ≦ 2) =.857 -.677 =.180 波以松分布.")
29
Example 4.4.5 Refer to Example 4.4.3. The average number of organisms per sample was found to be two. Find the probability that the next sample taken will contain more than five organisms. λ = 2 = μ P(X > 5 \ 2) = 1 - P(X ≦ 5) = 1 -.983 =.017 波以松分布
 = 1 - P(X ≦ 5) = 1 -.983 =.017 波以松分布.")
30
超幾何分布 ( Hyper-geometric Distribution ) – 抽樣時每次不放回,即各個試驗是不獨立的 Pr(A = a \ T1,T2,T3,T4;n) = (T1!T2!T3!T4!)/(n! a! b! c! d!) – 袋中 100 個球中有紅球 20 個及白球 80 個,若 抽出 5 球(每次不放回),則紅球出現兩個的 機率為多少? –Pr(A = 2) (20!80!5!95!) (100! 2! 3! 18! 77!) 紅 白 抽出 5 不抽出 95 2080100 23 1877 = 超幾何分布
 – 袋中 100 個球中有紅球 20 個及白球 80 個,若 抽出 5 球(每次不放回),則紅球出現兩個的 機率為多少? –Pr(A = 2) (20!80!5!95!) ( !) 紅 白 抽出 5 不抽出 = 超幾何分布.")
31
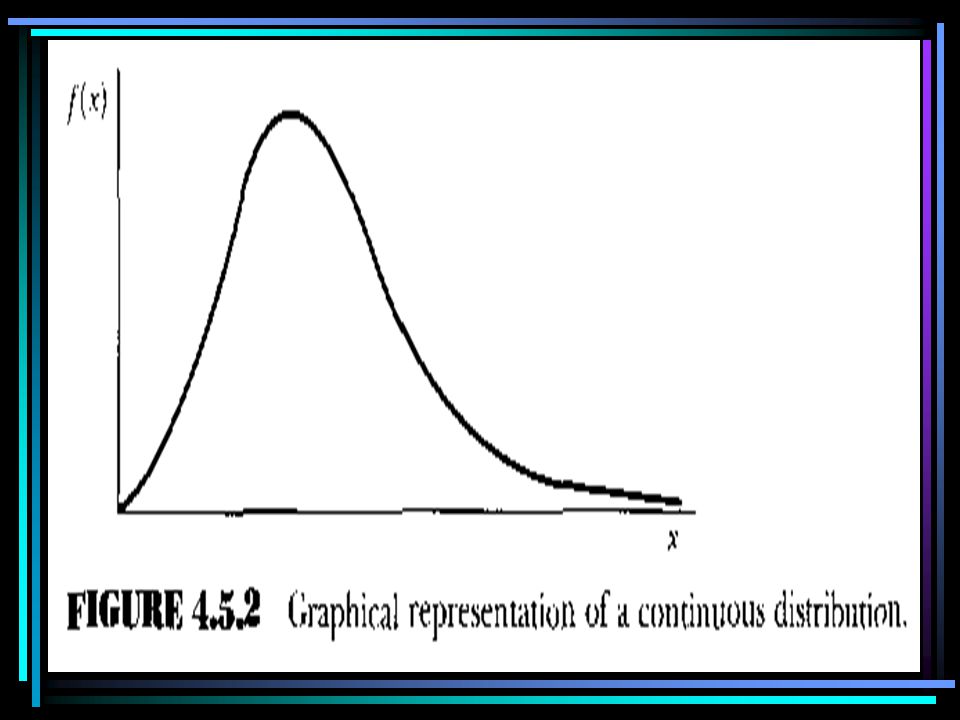
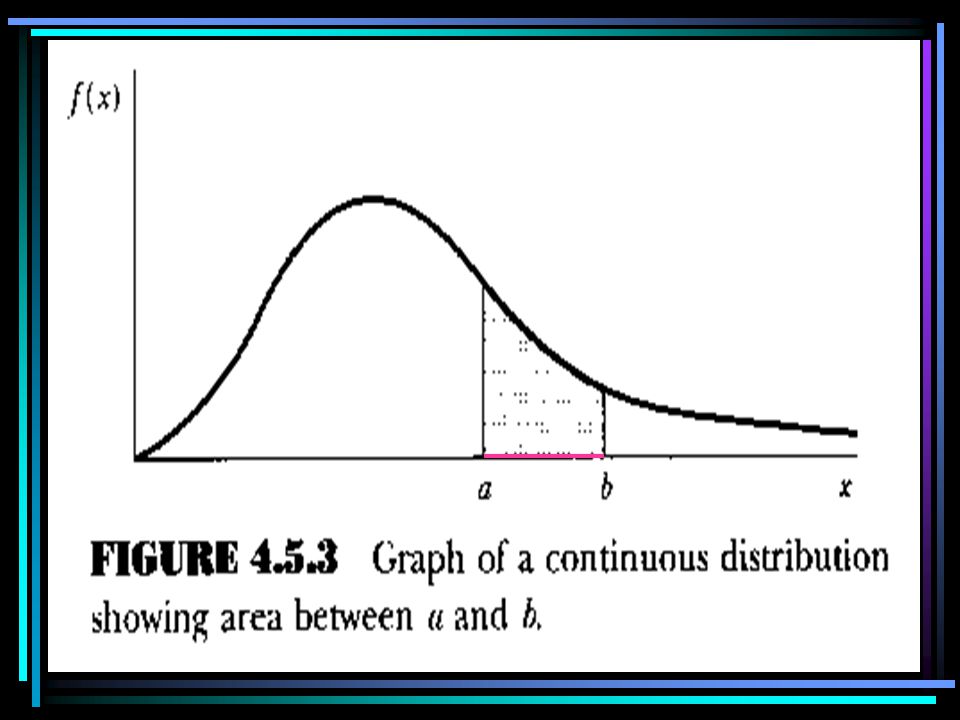
Definition A nonnegative function f(x) is called a probability distribution (sometimes called a probability density function) of the continuous random variable X if the total area bounded by its curve and the x-axis is equal to 1 and if the subarea under the curve bounded by the curve, the x-axis, and perpendiculars erected at any two points a and b gives the probability that X is between the points a and b.
 is called a probability distribution (sometimes called a probability density function) of the continuous random variable X if the total area bounded by its curve and the x-axis is equal to 1 and if the subarea under the curve bounded by the curve, the x-axis, and perpendiculars erected at any two points a and b gives the probability that X is between the points a and b.")
35
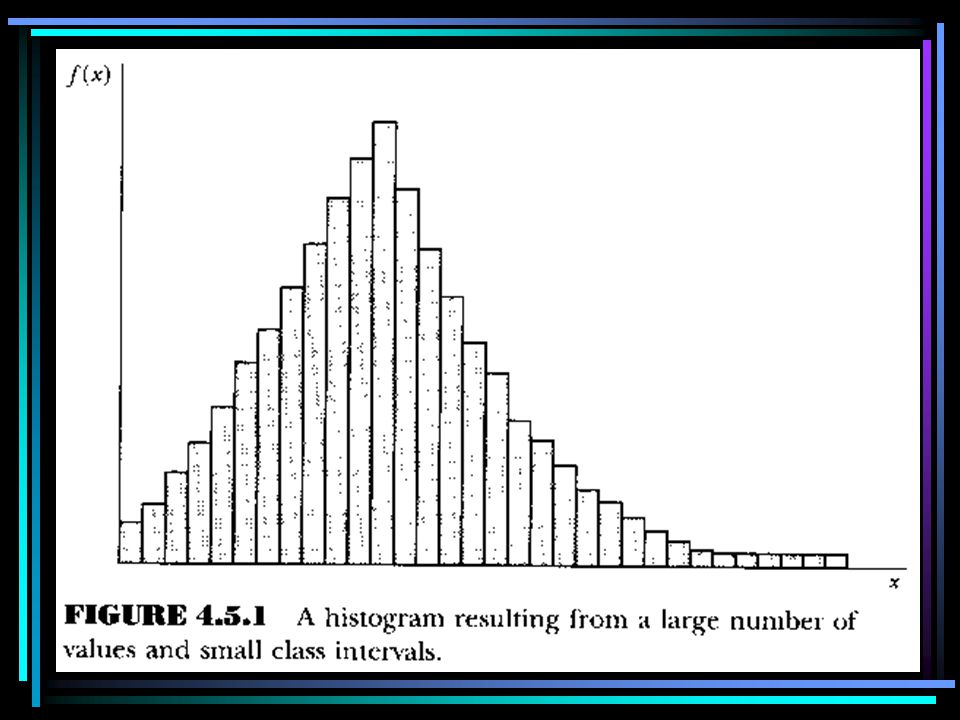
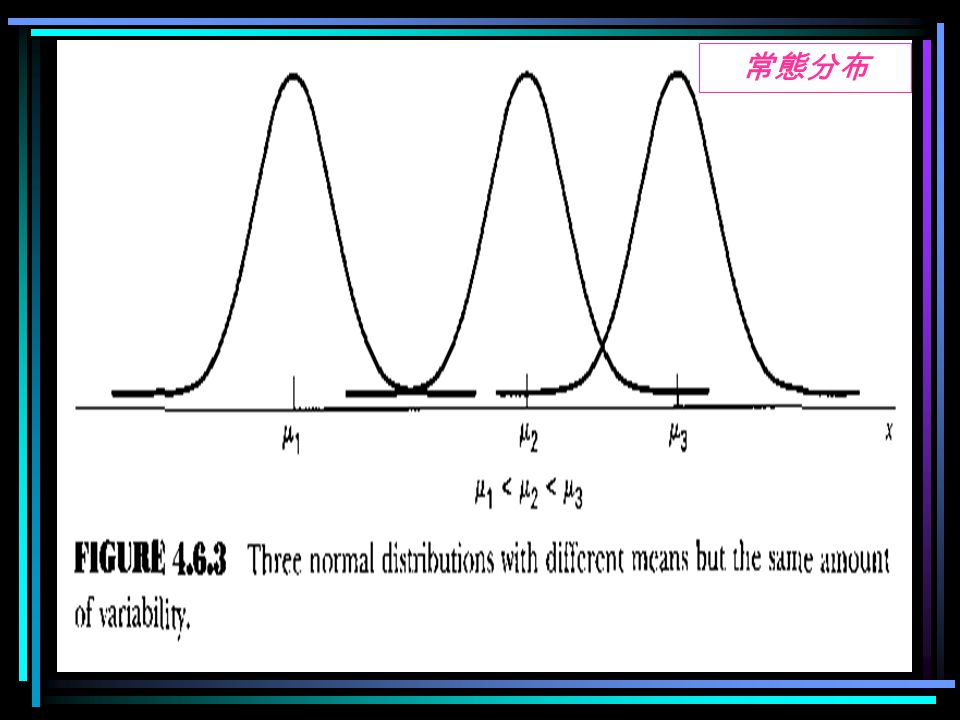
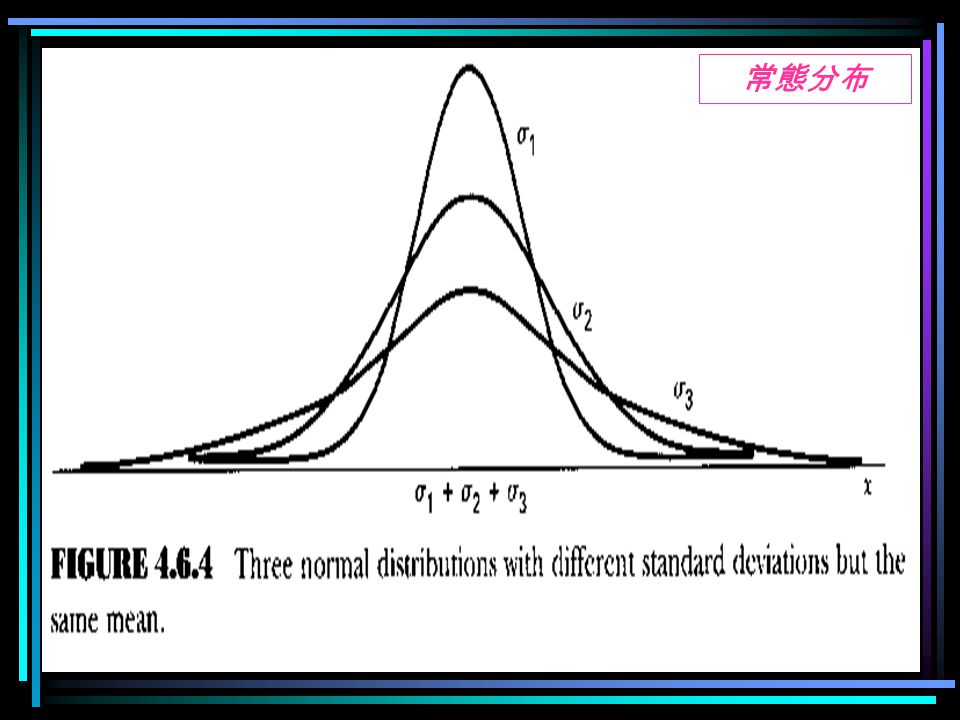
連續性機率分布 (Probability Density Function) 直方圖中每個長方形面積比即為相對次數,亦即機 率密度,而 Pr(X ⊂ A) 完全決定於 f(x) , f(x) 稱為機 率密度函數,是一種理論機率,其 Pr(a ≦ X ≦ b) = 1 , 0 ≦ Pr(X) ≦ 1 。 – 常態分布 (Normal Distribution ; GAUSSIAN Distribution ); X ~ N(μ,σ 2 ) f(x) =( 1/σ(2π) 1/2 ) × e -(x - μ) 2 ∕(2σ 2 ) [-∞ < x < ∞] – 標準常態分布 (Standardized Normal Distribution ; Z Distribution ); Z ~ N(0,1) f(Z) =( 1/ (2π) 1/2 ) × e -z 2 ∕2 [-∞ < z < ∞] 標準分數;相對偏差 (Standardized value, Critical ratio, Relative deviate, Normal deviate) ,即 Z = (X - μ)∕σ
![連續性機率分布 (Probability Density Function) 直方圖中每個長方形面積比即為相對次數,亦即機 率密度,而 Pr(X ⊂ A) 完全決定於 f(x) , f(x) 稱為機 率密度函數,是一種理論機率,其 Pr(a ≦ X ≦ b) = 1 , 0 ≦ Pr(X) ≦ 1 。 – 常態分布 (Normal Distribution ; GAUSSIAN Distribution ); X ~ N(μ,σ 2 ) f(x) =( 1/σ(2π) 1/2 ) × e -(x - μ) 2 ∕(2σ 2 ) [-∞ < x < ∞] – 標準常態分布 (Standardized Normal Distribution ; Z Distribution ); Z ~ N(0,1) f(Z) =( 1/ (2π) 1/2 ) × e -z 2 ∕2 [-∞ < z < ∞] 標準分數;相對偏差 (Standardized value, Critical ratio, Relative deviate, Normal deviate) ,即 Z = (X - μ)∕σ](http://images.slideplayer.com/12/3394606/slides/slide_35.jpg "連續性機率分布 (Probability Density Function) 直方圖中每個長方形面積比即為相對次數,亦即機 率密度,而 Pr(X ⊂ A) 完全決定於 f(x) , f(x) 稱為機 率密度函數,是一種理論機率,其 Pr(a ≦ X ≦ b) = 1 , 0 ≦ Pr(X) ≦ 1 。 – 常態分布 (Normal Distribution ; GAUSSIAN Distribution ); X ~ N(μ,σ 2 ) f(x) =( 1/σ(2π) 1/2 ) × e -(x - μ) 2 ∕(2σ 2 ) [-∞ < x < ∞] – 標準常態分布 (Standardized Normal Distribution ; Z Distribution ); Z ~ N(0,1) f(Z) =( 1/ (2π) 1/2 ) × e -z 2 ∕2 [-∞ < z < ∞] 標準分數;相對偏差 (Standardized value, Critical ratio, Relative deviate, Normal deviate) ,即 Z = (X - μ)∕σ")
36
連續性機率分布 (Probability Density Function) – t分布 (Student ’ s t -Distribution ) t (df) = (X - μ)∕S 或 t (df) = (X - μ x )∕S x – 卡方分布 (χ 2 Distribution ; Chi-square Distribution) χ k 2 = ΣZ i 2 df = k χ 2 =( S 2 /(n-1) ) / 2 df = n - 1 χ 2 = Σ ( (O - E) 2 /E ) df = (C - 1)(R - 1) – F分布 ( F Distribution ) F = S 1 2 /S 2 2 k k
 – t分布 (Student ’ s t -Distribution ) t (df) = (X - μ)∕S 或 t (df) = (X - μ x )∕S x – 卡方分布 (χ 2 Distribution ; Chi-square Distribution) χ k 2 = ΣZ i 2 df = k χ 2 =( S 2 /(n-1) ) / 2 df = n - 1 χ 2 = Σ ( (O - E) 2 /E ) df = (C - 1)(R - 1) – F分布 ( F Distribution ) F = S 1 2 /S 2 2 k k")
37
[-∞ < x <+ ∞] e -(x - μ) 2 ∕(2σ 2 ) f( X ) = σ(2π) 1/2 常態分布 X ~ N(μ,σ 2 )
![[-∞ < x <+ ∞] e -(x - μ) 2 ∕(2σ 2 ) f( X ) = σ(2π) 1/2 常態分布 X ~ N(μ,σ 2 )](http://images.slideplayer.com/12/3394606/slides/slide_37.jpg "[-∞ < x <+ ∞] e -(x - μ) 2 ∕(2σ 2 ) f( X ) = σ(2π) 1/2 常態分布 X ~ N(μ,σ 2 )")
38
常態分布

41
e -z 2 ∕2 f(Z) = (2π) 1/2 [-∞ < z < +∞] 標準常態分布 Z ~ N(0,1)
![e -z 2 ∕2 f(Z) = (2π) 1/2 [-∞ < z < +∞] 標準常態分布 Z ~ N(0,1)](http://images.slideplayer.com/12/3394606/slides/slide_41.jpg "e -z 2 ∕2 f(Z) = (2π) 1/2 [-∞ < z < +∞] 標準常態分布 Z ~ N(0,1)")
42
標準常態分布

43
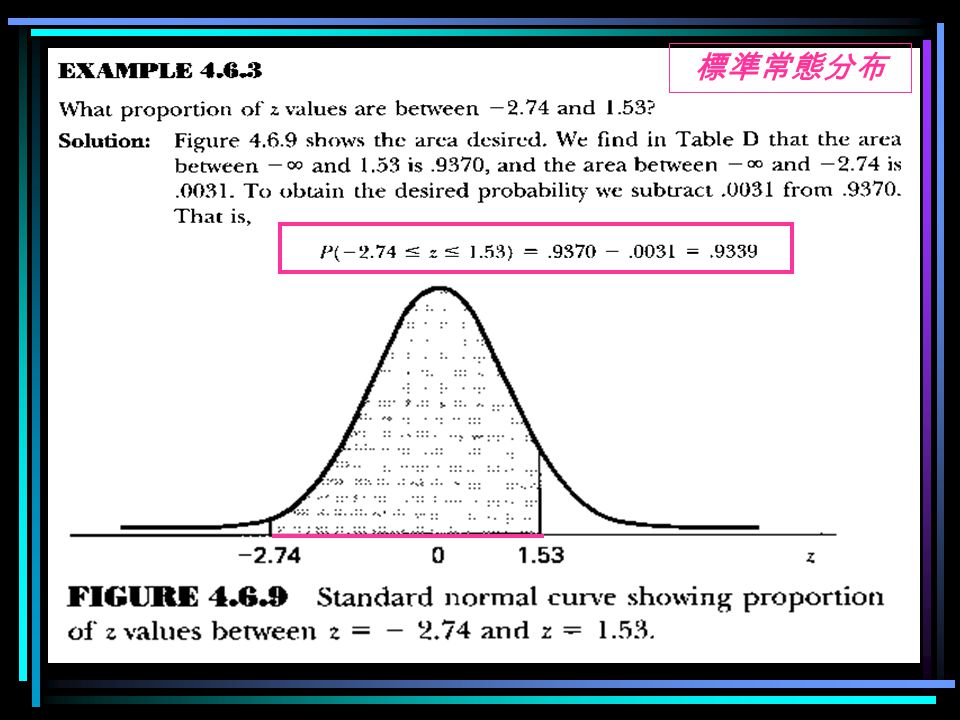
Given the standard normal distribution, find the area under the curve, above the z-axis between z =- ∞ and z = 2. Example 4.6.1 標準常態分布

44
P( - 2.55 < z < 2.55) =.9946 -.0054 =.9892 What is the probability that a z picked at random from the population of z ’ s will have a value between - 2.55 and + 2.55? Example 4.6.2 標準常態分布

48
常態分布 標準常態分布

49
Z=(800-1076.80)/105.76 常態分布 標準常態分布
/ 常態分布 標準常態分布")
50
Z=(65-70)/3=-1.67Z=(74-70)/3=+1.33 3 常態分布 標準常態分布
/3=-1.67Z=(74-70)/3= 常態分布 標準常態分布")
51
Thanks for your attention To be continued …..

Similar presentations


 = aE(X) + b E(X+Y) = E(X) + E(Y)>")

 林良恭 (族群生態及種間互動 4/1) 孫義方 (群聚生態及生態系 5/13)>")


 一種質性資料, 其觀察值可歸類於數個不相交的項目內, 例 : 性別, 滿意度, …, 一般以各項的統計次數表現. 分析此種資料,通常用卡方檢定 類別資料分析 ----- 卡方檢定 卡方檢定基本理論 一個含有 k 項的試驗,設 p i.>")
- 朝陽科技大學 資訊管理系 李麗華 教授.>")


 ,用樣本 s 來取代 因為用 s 來估計 ,所呈現出來的分佈已不 是 z distribution ,而是 t distribution.>")


 的設計與實作 指導教授:黃毅然 教授 學生:葉雅琳 系別:資訊工程學系.>")