Download presentation
Presentation is loading. Please wait.

1
Biostatistics Case Studies 2005 Peter D. Christenson Biostatistician http://gcrc.humc.edu/Biostat Session 1: Study Design for Demonstrating Lack of Treatment Effect: Equivalence or Non-inferiority

2
Case Study

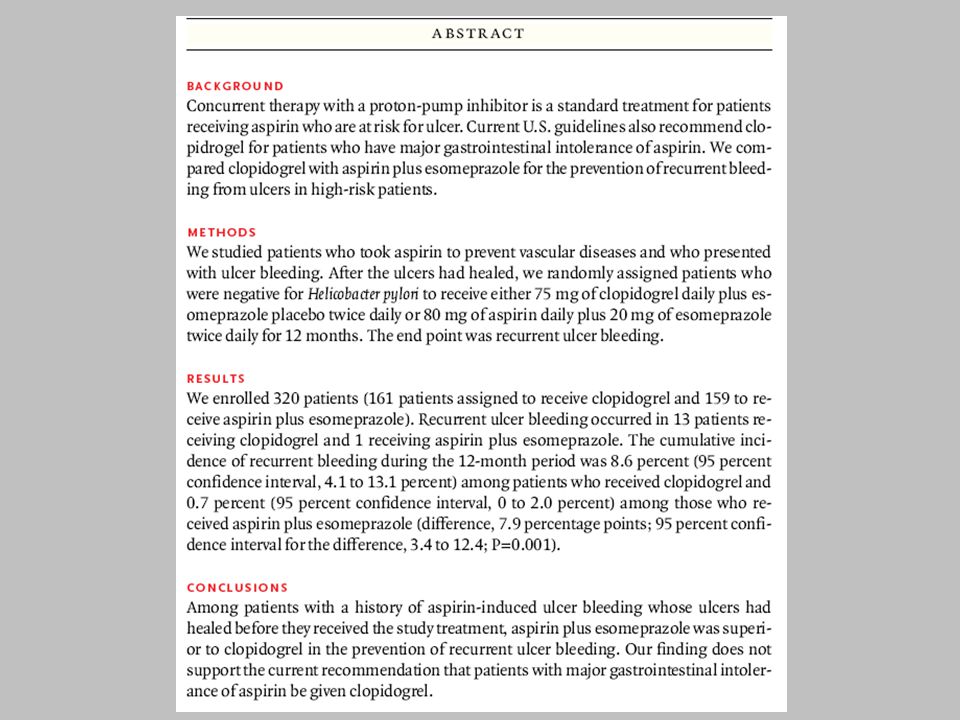
4
p ASA+PPI = 1.5% Demonstrate: p clop – p ASA+PPI ≤ 4% N=145/group Power=80% for what?

5
Typical Analysis: Inferiority or Superiority H 0 : p clop – p ASA+PPI = 0% H 1 : p clop – p ASA+PPI ≠ 0% H 1 → therapies differ α = 0.05 Power = 80% for Δ=|p clop - p ASA+PPI | =? Clop inferior = 95% CI for p clop – p ASA+PPI Clop superior 0 0 p clop – p ASA+PPI [Not used in this paper] 0 p clop – p ASA+PPI No diff detected* * and 80% chance that a Δ of (?) or more would be detected.
 or more would be detected..")
6
Typical Analysis: Inferiority or Superiority H 0 : p clop – p ASA+PPI = 0% H 1 : p clop – p ASA+PPI ≠ 0% H 1 → therapies differ α = 0.05 Power = 80% for Δ=|p clop - p ASA+PPI | =? [Not used in this paper] So, N=331/group → 80% chance that a Δ of 4% or more would be detected. Detectable Δ = 5.5%-1.5%=4%

7
Typical Analysis: Inferiority or Superiority H 0 : p clop – p ASA+PPI = 0% H 1 : p clop – p ASA+PPI ≠ 0% H 1 → therapies differ α = 0.05 Power = 80% for Δ=|p clop - p ASA+PPI | =4% [Not used in this paper] H 0 : p clop – p ASA+PPI ≤ 0% H 1 : p clop – p ASA+PPI > 0% H 1 → clop inferior Note that this could be formulated as two one-sided tests (TOST): α = 0.025 Power = 80% for p clop - p ASA+PPI =4% H 0 : p clop – p ASA+PPI ≥ 0% H 1 : p clop – p ASA+PPI < 0% H 1 → clop superior α = 0.025 Power = 80% for p clop - p ASA+PPI =-4%
![Typical Analysis: Inferiority or Superiority H 0 : p clop – p ASA+PPI = 0% H 1 : p clop – p ASA+PPI ≠ 0% H 1 → therapies differ α = 0.05 Power = 80% for Δ=|p clop - p ASA+PPI | =4% [Not used in this paper] H 0 : p clop – p ASA+PPI ≤ 0% H 1 : p clop – p ASA+PPI > 0% H 1 → clop inferior Note that this could be formulated as two one-sided tests (TOST): α = Power = 80% for p clop - p ASA+PPI =4% H 0 : p clop – p ASA+PPI ≥ 0% H 1 : p clop – p ASA+PPI < 0% H 1 → clop superior α = Power = 80% for p clop - p ASA+PPI =-4%](http://images.slideplayer.com/12/3384579/slides/slide_7.jpg "Typical Analysis: Inferiority or Superiority H 0 : p clop – p ASA+PPI = 0% H 1 : p clop – p ASA+PPI ≠ 0% H 1 → therapies differ α = 0.05 Power = 80% for Δ=|p clop - p ASA+PPI | =4% [Not used in this paper] H 0 : p clop – p ASA+PPI ≤ 0% H 1 : p clop – p ASA+PPI > 0% H 1 → clop inferior Note that this could be formulated as two one-sided tests (TOST): α = Power = 80% for p clop - p ASA+PPI =4% H 0 : p clop – p ASA+PPI ≥ 0% H 1 : p clop – p ASA+PPI < 0% H 1 → clop superior α = Power = 80% for p clop - p ASA+PPI =-4%")
8
Demonstrating Equivalence H 0 : |p clop – p ASA+PPI | ≥ E% H 1 : |p clop – p ASA+PPI | < E% H 1 → therapies “equivalent”, within E [Not used in this paper] H 0 : p clop – p ASA+PPI ≤ -4% H 1 : p clop – p ASA+PPI > -4% H 1 → clop non-superior Note that this could be formulated as two one-sided tests (TOST): α = 0.025 Power = 80% for p clop - p ASA+PPI = 0% H 0 : p clop – p ASA+PPI ≥ 4% H 1 : p clop – p ASA+PPI < 4% H 1 → clop non-inferior α = 0.025 Power = 80% for p clop - p ASA+PPI = 0%
![Demonstrating Equivalence H 0 : |p clop – p ASA+PPI | ≥ E% H 1 : |p clop – p ASA+PPI | < E% H 1 → therapies equivalent , within E [Not used in this paper] H 0 : p clop – p ASA+PPI ≤ -4% H 1 : p clop – p ASA+PPI > -4% H 1 → clop non-superior Note that this could be formulated as two one-sided tests (TOST): α = Power = 80% for p clop - p ASA+PPI = 0% H 0 : p clop – p ASA+PPI ≥ 4% H 1 : p clop – p ASA+PPI < 4% H 1 → clop non-inferior α = Power = 80% for p clop - p ASA+PPI = 0%](http://images.slideplayer.com/12/3384579/slides/slide_8.jpg "Demonstrating Equivalence H 0 : |p clop – p ASA+PPI | ≥ E% H 1 : |p clop – p ASA+PPI | < E% H 1 → therapies equivalent , within E [Not used in this paper] H 0 : p clop – p ASA+PPI ≤ -4% H 1 : p clop – p ASA+PPI > -4% H 1 → clop non-superior Note that this could be formulated as two one-sided tests (TOST): α = Power = 80% for p clop - p ASA+PPI = 0% H 0 : p clop – p ASA+PPI ≥ 4% H 1 : p clop – p ASA+PPI < 4% H 1 → clop non-inferior α = Power = 80% for p clop - p ASA+PPI = 0%")
9
Demonstrating Equivalence H 0 : |p clop – p ASA+PPI | ≥ 4% H 1 : |p clop – p ASA+PPI | < 4% H 1 → equivalence α = 0.05 Power = 80% for p clop - p ASA+PPI = 0 Clop non-superior = 95% CI for p clop – p ASA+PPI Clop non-inferior 0 0 p clop – p ASA+PPI 0 Equivalence* -44 4 4 * both non-superior and non-inferior.

10
This Paper: Inferiority and Non-Inferiority H 0 : p clop – p ASA+PPI ≤ 0% H 1 : p clop – p ASA+PPI > 0% H 1 → clop inferior Apparently, two one-sided tests (TOST), but only one explicitly powered: α = 0.025 Power = 80% for p clop - p ASA+PPI = ?% H 0 : p clop – p ASA+PPI ≥ 4% H 1 : p clop – p ASA+PPI < 4% H 1 → clop non-inferior α = 0.025 Power = 80% for p clop - p ASA+PPI = 0% The authors chose E=4% as the maximum therapy difference that therapies are considered equivalent.
, but only one explicitly powered: α = Power = 80% for p clop - p ASA+PPI = % H 0 : p clop – p ASA+PPI ≥ 4% H 1 : p clop – p ASA+PPI < 4% H 1 → clop non-inferior α = Power = 80% for p clop - p ASA+PPI = 0% The authors chose E=4% as the maximum therapy difference that therapies are considered equivalent.")
11
This Paper: Inferiority and Non-Inferiority Clop inferior = 95% CI for p clop – p ASA+PPI Clop non-inferior 0 0 p clop – p ASA+PPI 0 “Non-clinical” inferiority* -44 4 4 * clop is statistically inferior, but not enough for clinical significance. Decisions: Observed Results: p clop = 8.6%; p ASA+PPI = 0.7%; 95% CI = 3.4 to 12.4 12 0-44 p clop – p ASA+PPI Clop inferior

12
Power for Test of Clopidrogrel Non-Inferiority H 0 : p clop – p ASA+PPI ≥ 4% H 1 : p clop – p ASA+PPI < 4% H 1 → clop non-inferior α = 0.025 Power = 80% for p clop - p ASA+PPI = 0%

13
Power for Test of Clopidrogrel Inferiority H 0 : p clop – p ASA+PPI ≤ 0% H 1 : p clop – p ASA+PPI > 0% H 1 → clop inferior α = 0.025 Power = 80% for p clop - p ASA+PPI = 7.3% Detectable Δ = 8.8%-1.5%=7.3%

14
Conclusions: This Paper In this paper, clop was so inferior that investigators were apparently lucky to have enough power for detecting it. The CI was too wide with this N for detecting a smaller therapy difference. Investigators justify testing non-inferiority of clop only (and not of Aspirin + Nexium) with the lessened desirability of combination therapy (?). I feel that this is a good approach for size and power for a new competing therapy against a standard, if the N for clop inferiority had been considered also. Note that power calculations were based on actual %s of subjects, whereas cumulative 12-month incidence was used in the analysis. There are not power calculations for equivalency tests using survival analysis, that I know of.
 with the lessened desirability of combination therapy ( ). I feel that this is a good approach for size and power for a new competing therapy against a standard, if the N for clop inferiority had been considered also. Note that power calculations were based on actual %s of subjects, whereas cumulative 12-month incidence was used in the analysis. There are not power calculations for equivalency tests using survival analysis, that I know of..")
15
Conclusions: General “Negligibly inferior” would be better than non-inferior. All inference can be based on confidence intervals. Pre-specify the comparisons to be made, which can be defined as where confidence intervals lie. Ns are smaller for equivalence tests, but study may be underpowered to detect differences if that is the case, unless specifically designed for that. Power for only one or for multiple comparisons. Power can be different for different comparisons. For large N, reversing α and β=1-power for the typical test gives the same N as for equivalence test.

16
Appendix: Possible Errors in Study Conclusions Truth: H 0 : No EffectH 1 : Effect No Effect Effect Study Claims: Correct Error (Type I) Error (Type II) Power: Maximize Choose N for 80% Set α=0.05 Specificity=95% Specificity Sensitivity Typical study to demonstrate superiority/inferiority
 Error (Type II) Power: Maximize Choose N for 80% Set α=0.05 Specificity=95% Specificity Sensitivity Typical study to demonstrate superiority/inferiority")
17
Appendix: Graphical Representation of Power H0H0 HAHA H 0 : true effect=0 H A : true effect=3 Effect in study=1.13 \\\ = Probability of concluding H A if H 0 is true. 41% 5% Effect (Group B mean – Group A mean) /// = Probability of concluding H 0 if H A is true. Power=100-41=59% Note greater power if larger N, and/or if true effect>3, and/or less subject heterogeneity. N=100 per Group Larger Ns give narrower curves Typical study to demonstrate superiority/inferiority
 /// = Probability of concluding H 0 if H A is true. Power=100-41=59% Note greater power if larger N, and/or if true effect>3, and/or less subject heterogeneity. N=100 per Group Larger Ns give narrower curves Typical study to demonstrate superiority/inferiority.")
18
www.stat.uiowa.edu/~rlenth/Power Appendix: Online Study Size / Power Calculator Does NOT include tests for equivalence or non- inferiority or non- superiority

Similar presentations
 regarding unknown population parameter values based on sample data Elements of a hypothesis test: Null hypothesis.>")


