Download presentation
Presentation is loading. Please wait.

1
IIIG LTMS V2 Review

2
LTMS V2 Review Data Summary: – Includes 285 Chartable reference oil results from all test laboratories – Most recent chartable reference oil result included in data set is March 22, 2010 – Includes all ACLW data that is currently exhibiting a mild trend – WPD and PVIS defined as “Primary Parameters” – ACLW defined as “Secondary Parameters”

3
LTMS V2 Review Proposed Limits for IIIG LTMS v2 example: – Limits for e i & z i : Shewhart Chart of Prediction Error e i = Y i – Z i-1 Limit TypeLimit* Level 3 2.066 Level 2 1.734 Level 1 1.351 EWMA of Standardized Test Result Z i = λ(Y i ) + (1 – λ)Z i-1 Limit TypeλLimit Level 2 Upper Limit0.2 TBD by SP Input Level 2 Lower Limit0.2 TBD by SP Input Level 10.20
 + (1 – λ)Z i-1 Limit TypeλLimit Level 2 Upper Limit0.2 TBD by SP Input Level 2 Lower Limit0.2 TBD by SP Input Level 10.20")
4
IIIG calibration attempt summary: – Of the 289 total, 73.3% acceptable, 17.3% failed acceptance, and 9.4% were invalid

5
IIIG Alarm Summary (all labs & chartable results): – Below summarizes the unacceptable, reduced, and extended reference interval count for LTMS v1 & v2.
: – Below summarizes the unacceptable, reduced, and extended reference interval count for LTMS v1 & v2.")
6
IIIG Alarm Summary (all labs & chartable results): – Below summarizes the unacceptable, reduced, and extended reference interval percentage for LTMS v1 & v2.
: – Below summarizes the unacceptable, reduced, and extended reference interval percentage for LTMS v1 & v2.")
7
IIIG Alarm Summary (by lab): – Below summarizes the unacceptable, reduced, and extended reference interval count for LTMS v1 & v2 by test lab (285 Chartable test results).
: – Below summarizes the unacceptable, reduced, and extended reference interval count for LTMS v1 & v2 by test lab (285 Chartable test results).")
8
IIIG RMSE for the PVIS parameter: – RMSE calculation is a function of the average deviation from the target and within lab variation.

9
IIIG Relative Pass limit of a Candidate test for the PVIS parameter:

10
IIIG RMSE for the WPD parameter: – RMSE calculation is a function of the average deviation from the target and within lab variation.

11
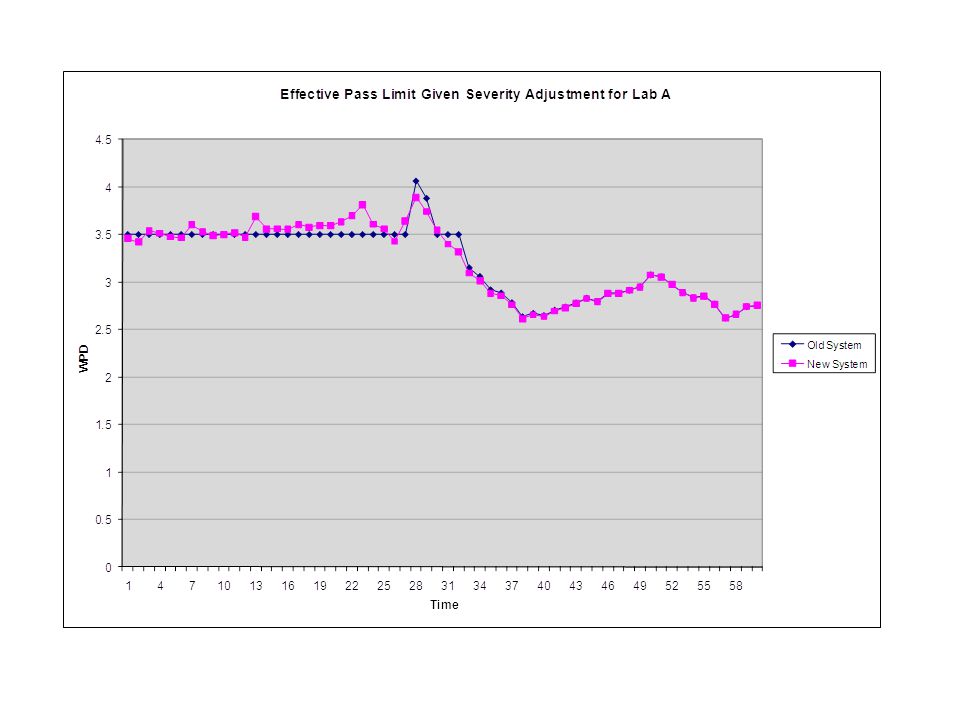
IIIG Relative Pass limit of a Candidate test for the WPD parameter (with a [GF-4] 3.5 limit):
![IIIG Relative Pass limit of a Candidate test for the WPD parameter (with a [GF-4] 3.5 limit):](http://images.slideplayer.com/12/3356818/slides/slide_11.jpg "IIIG Relative Pass limit of a Candidate test for the WPD parameter (with a [GF-4] 3.5 limit):")
12
IIIG RMSE for the ACLW parameter: – RMSE calculation is a function of the average deviation from target and within lab variation.

13
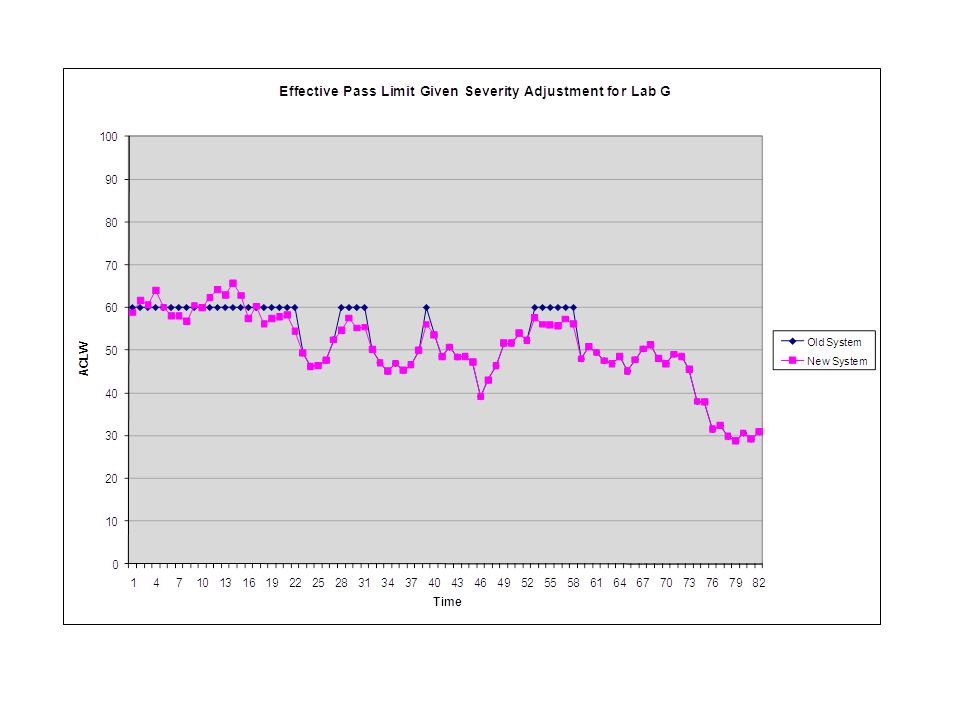
IIIG Relative Pass limit of a Candidate test for the ACLW parameter:

14
Undue Influence example for TPVIS (e i ) data – Plot of e i data with no Undue Influence adjustment
 data – Plot of e i data with no Undue Influence adjustment")
15
Undue Influence example for TPVIS (e i ) data – Circled results with “capped” adjustment (at +2.066 limit) Result adjusted if |Y i – Z i-1 | > 2.066 and |Y i – Y i+1 | > 2.066
 data – Circled results with capped adjustment (at limit) Result adjusted if |Y i – Z i-1 | > and |Y i – Y i+1 | > 2.066")
16
Undue Influence “Capped” Result Summary – (285 Total Chartable results)
")
17
Appendix LTMS V2 Charts By Test Lab

18
Lab A

22
Lab B

26
Lab D

30
Lab E

34
Lab F

38
Lab G

Similar presentations


 Concepts to cover or review today: –Population parameter –Sample statistics –Mean –Standard deviation –Coefficient of variation.>")


 ◦ 35 test stands 2 stands only had one ref.>")


 Used to show parts of a fixed whole. Usually parts are labeled as percents with the circle representing.>")


