Download presentation
Presentation is loading. Please wait.

1
BY ROSELINE ANTAI CLUTO A Clustering Toolkit

2
What is CLUTO? CLUTO is a software package which is used for clustering high dimensional datasets and for analyzing the characteristics of the various clusters.

3
Algorithms of CLUTO vcluster scluster Major difference: Input format vcluster: actual multidimensional representation of the objects to be clustered. scluster: The similarity matrix (or graph) between these objects.
 between these objects..")
4
Calling Sequence vcluster [optional parameters] MatrixFile Nclusters scluster [optional parameters] MatrixFile NClusters
![Calling Sequence vcluster [optional parameters] MatrixFile Nclusters scluster [optional parameters] MatrixFile NClusters](http://images.slideplayer.com/11/3266185/slides/slide_4.jpg "Calling Sequence vcluster [optional parameters] MatrixFile Nclusters scluster [optional parameters] MatrixFile NClusters")
5
Optional Parameters Standard specification -paramname or –paramname = value Three categories: Clustering algorithm parameters Reporting and Analysis parameters Cluster Visualization parameters

6
Clustering algorithm parameters Control how CLUTO computes the clustering solution. Examples 1. -clmethod=string ( rb, agglo,direct,graph, etc) 2. -sim = string (cos,corr,dist,jacc) 3. -crfun = string (i1,i2 etc) 4. -fulltree
 2. -sim = string (cos,corr,dist,jacc) 3. -crfun = string (i1,i2 etc) 4. -fulltree.")
7
Reporting and Analysis Parameters Control the amount of information that vcluster and scluster report about the clusters as well as the analysis performed on discovered clusters. Examples 1. -clustfile = string. ( Default is MatrixFile.clustering.Nclusters( or GraphFile)) 2. -clabelfile = string (name of the file that’s stores the labels of the columns. Used when –showfeatues, -showsummaries or –labeltree are used)
) 2. -clabelfile = string (name of the file that’s stores the labels of the columns. Used when –showfeatues, -showsummaries or –labeltree are used).")
8
3. -rlabelfile=string 4. -rclassfile=string (Stores the labels of the rows – objects to be clustered). 5. -showtree 6. -showfeatures (descriptive and discriminating)
. 5. -showtree 6. -showfeatures (descriptive and discriminating).")
9
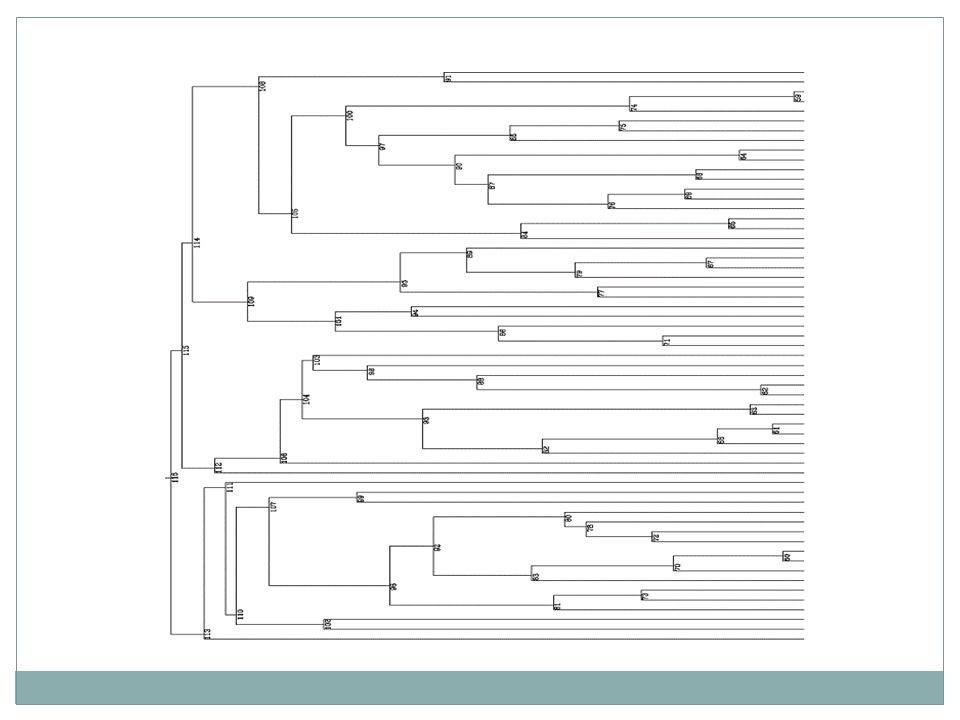
Cluster Visualization Parameters Simple plots of the original input matrix which show how the different objects (rows) and features (columns) are clustered together. Examples 1. -plottree = string; gives graphic representation of the entire hierarchical tree 2. -plotmatrix = string; shows how the rows of the original matrix are clustered together.

10
A practical example ../cluto/Linux/vcluster -clmethod=rb -sim=cos -fulltree - rlabelfile=Final_Results/rlabelfile - rclassfile=Final_Results/classfile -showtree -plotformat=gif - plottree=Final_Results/Images/PT-Final10d - plotmatrix=Final_Results/Images/PM-Final10d - plotclusters=Final_Results/Images/PC-Final10d - showfeatures Final_Results/FinalOutput10d-Vt.mat 4

12
Classfile and rlabelfile Evo Sem Imp Imp Deo Deo Imp Imp Deo Deo Imp Deo Deo Imp Sem Deo Sem Imp Imp Evo 0 1 2 3 4 5 6 7 8 9 10 11 12 13 14 15

13
Plotclusters output

15
The plot uses red to denote positive values and green to denote negative values. Bright red/green indicate large positive/negative values, whereas colors close to white indicate values close to zero.

Similar presentations


 Basic Knowledge about the Interface This is a usual Power Point Presentation. Use Mouse-Clicks.>")


 A microarray may contain thousands of ‘spots’. Each spot contains many copies of the same DNA sequence that uniquely represents a gene from.>")
 is becoming a routine technique to study white matter properties and alterations of fiber integrity due to pathology. The.>")


 Purpose Allows the analyst to create line plots, bar graphs and pie charts from data,>")
” was used for clustering The parameters to the function were : 1. The matrix of entire.>")


 Purpose Allows the analyst to visually analyze up to 5 time series plots on a single graph data samples by.>")
>")
