Download presentation
Presentation is loading. Please wait.

1
Microarray GEO – Microarray sets database
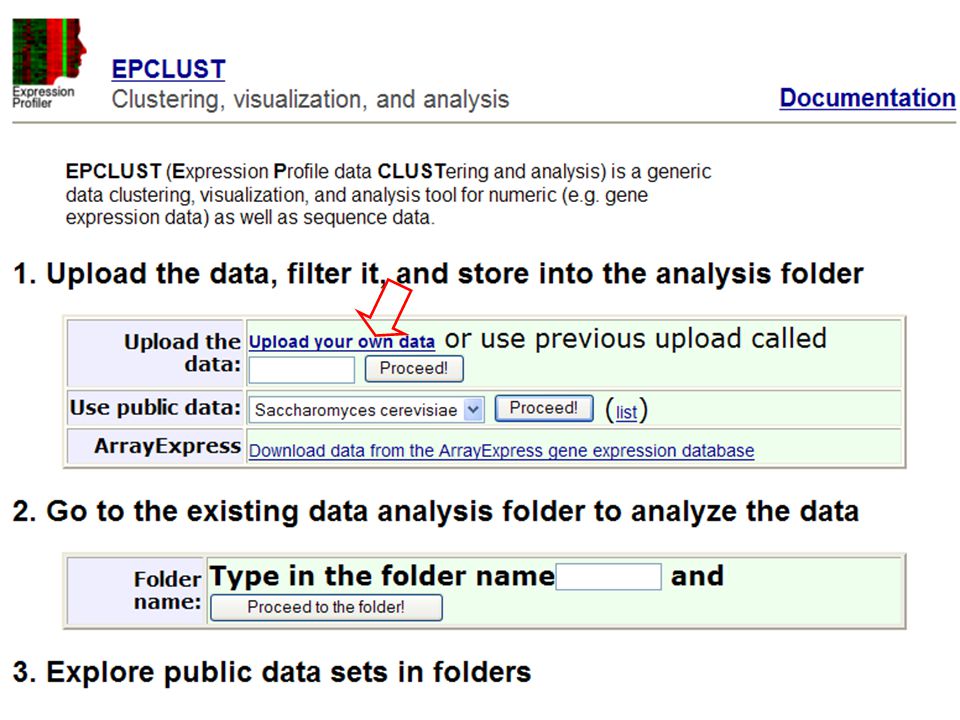
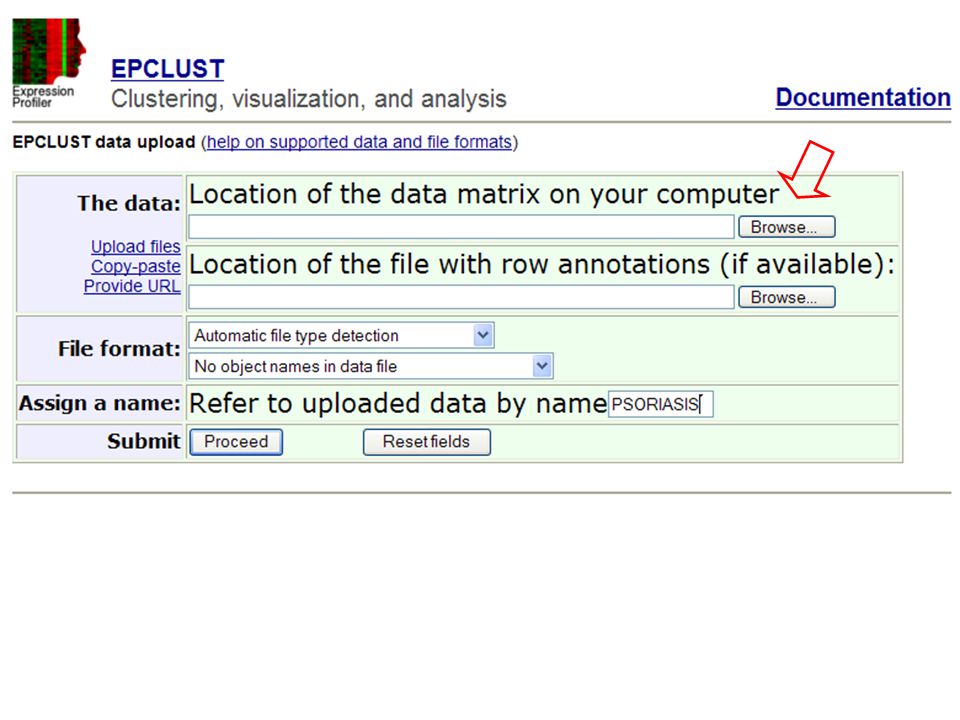
EPClust – Microarray data analysis

2
Microarray Data Matrix
Input Methods Unsupervised Clustering Hierarchical clustering Partition methods

3
Microarray Data Matrix
Each column represents all the gene expression levels from a single experiment. Each row represents the expression of a gene across all experiments.

4
Microarray Data Matrix
Each element is a log ratio: log2 (T/R), where T is the gene expression level in the testing sample, R is the gene expression level in the reference sample
, where T is the gene expression level in the testing sample, R is the gene expression level in the reference sample.")
5
Microarray Data Matrix

6
Different representations
Microarray Data: Different representations Log ratio Log ratio Exp Exp

7
Microarray Data: Clusters

8
Microarray Data: Clustering
Hierarchical Clustering :genes with similar expression patterns are grouped together and are connected by a series of branches (dendrogram).
.")
9
How to determine the similarity between two genes?

10
How to determine the similarity between two clusters?

11
How to determine the similarity between two clusters?

12
How to determine the similarity between two clusters?

13
Hierarchical clustering result

14
Microarray Data: Clustering
K-mean clustering is an algorithm to classify The data into K number of groups.

15
Microarray Data: Clustering
K-mean clustering is an algorithm to classify The data into K number of groups.

16
Microarray Data: Clustering
K-mean clustering is an algorithm to classify The data into K number of groups.

17
Expression profiles by gene
Like Series,but further curated and suitable for analysis with GEO tools Expression profiles by gene Probe sets *further curated= statistically comparable datasets Microarray experiments Groups of related microarray experiments

18
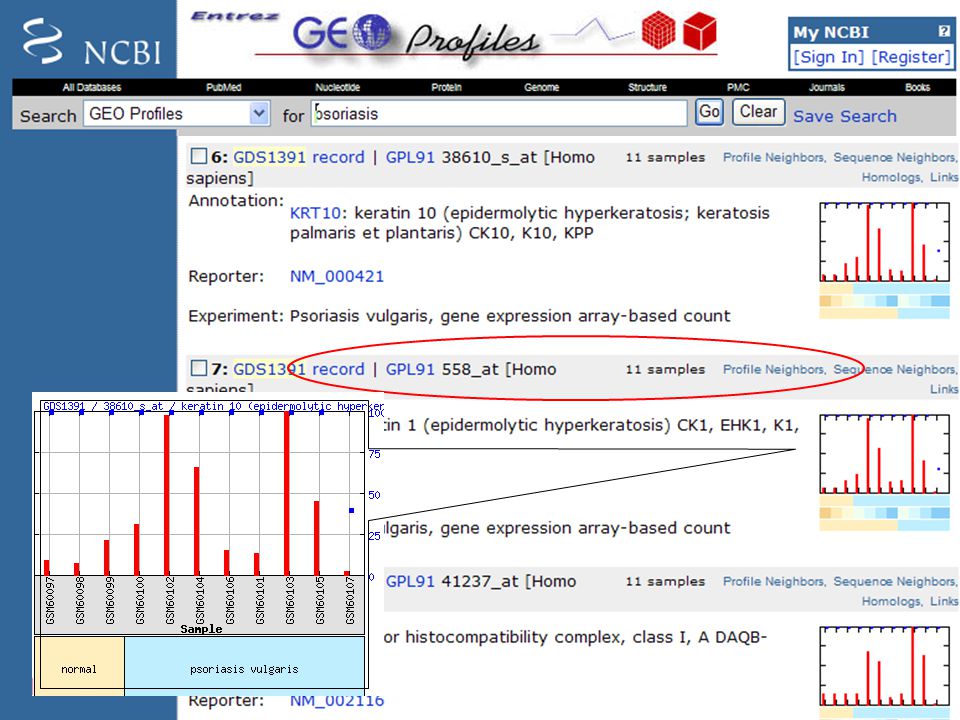
Platform: Affymetrix GeneChip Human Genome Samples: 11 psoriasis patients

19
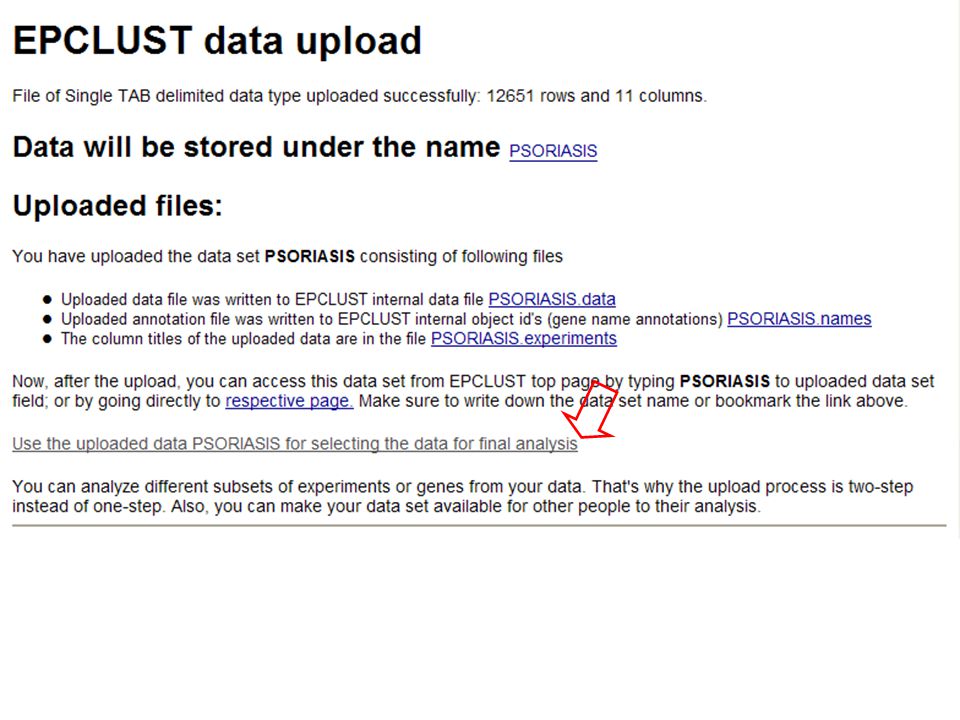
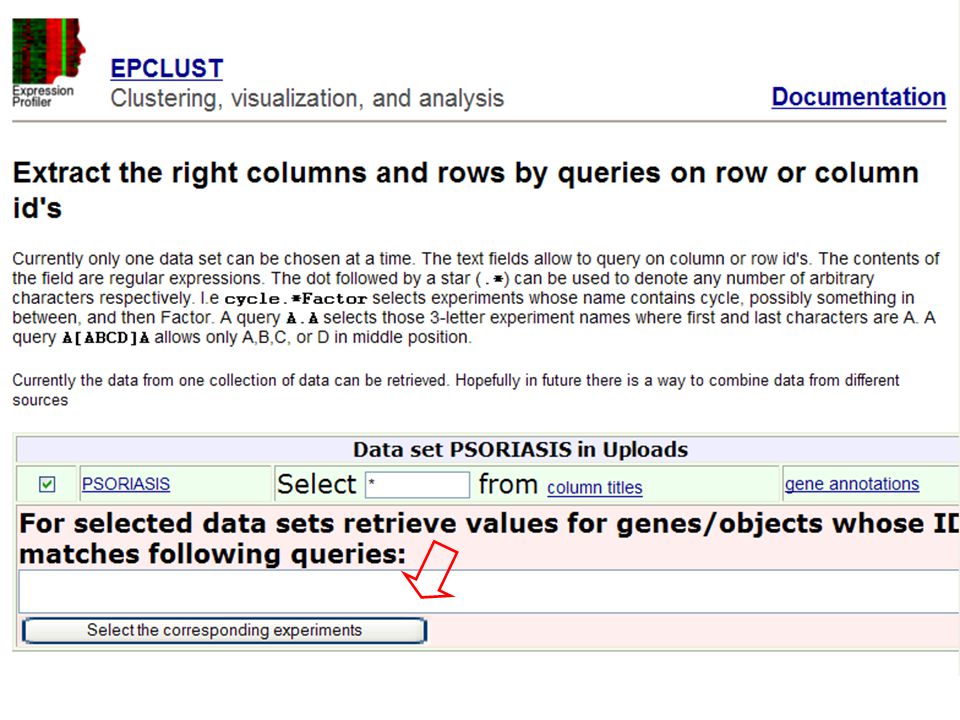
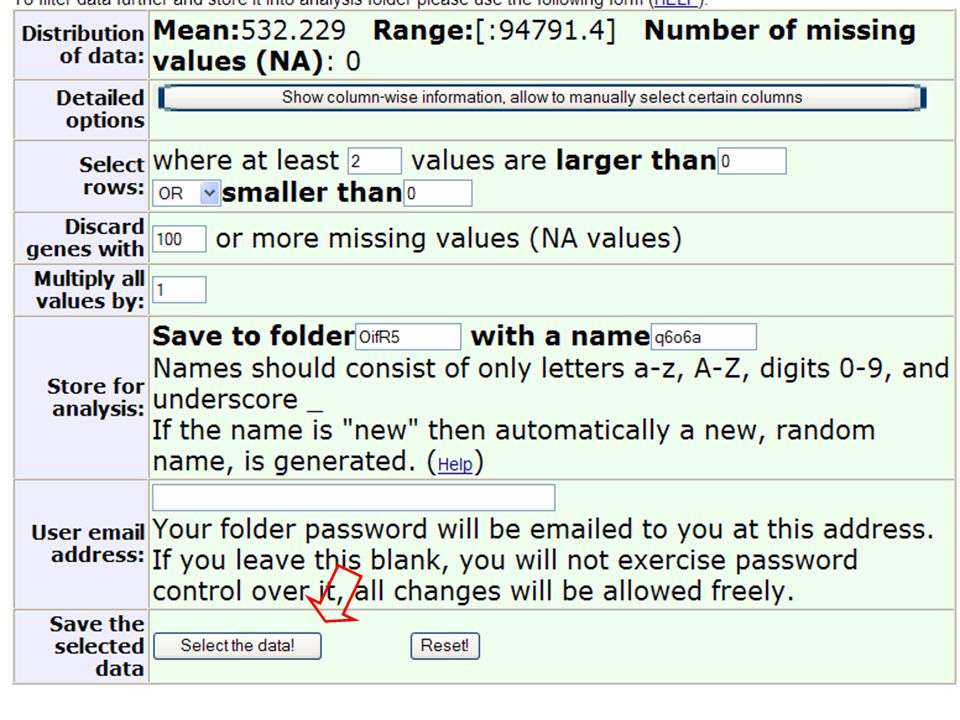
Download dataset Clustering Statistic analysis

21
Searching for expression profiles in the Human Genome browser.

22
Keratine 10 is highly expressed in skin

28
Transpose,Normalize,Randomize

29
Samples found in cluster
Graphical representation of the cluster Graphical representation of the cluster

30
Initial seeds Final seeds 10 clusters

Similar presentations

 is a USDA-funded public repository for plant microarray data. BarleyBase houses raw and normalized expression.>")


 Dimension reduction theory (PCA/Clustering) Dimension reduction.>")

 A microarray may contain thousands of ‘spots’. Each spot contains many copies of the same DNA sequence that uniquely represents a gene from.>")


 Analysis of co-expression Search for similarly expressed genes experiment1 experiment2 experiment3 ……….. Gene i:>")


