Download presentation
Presentation is loading. Please wait.

1
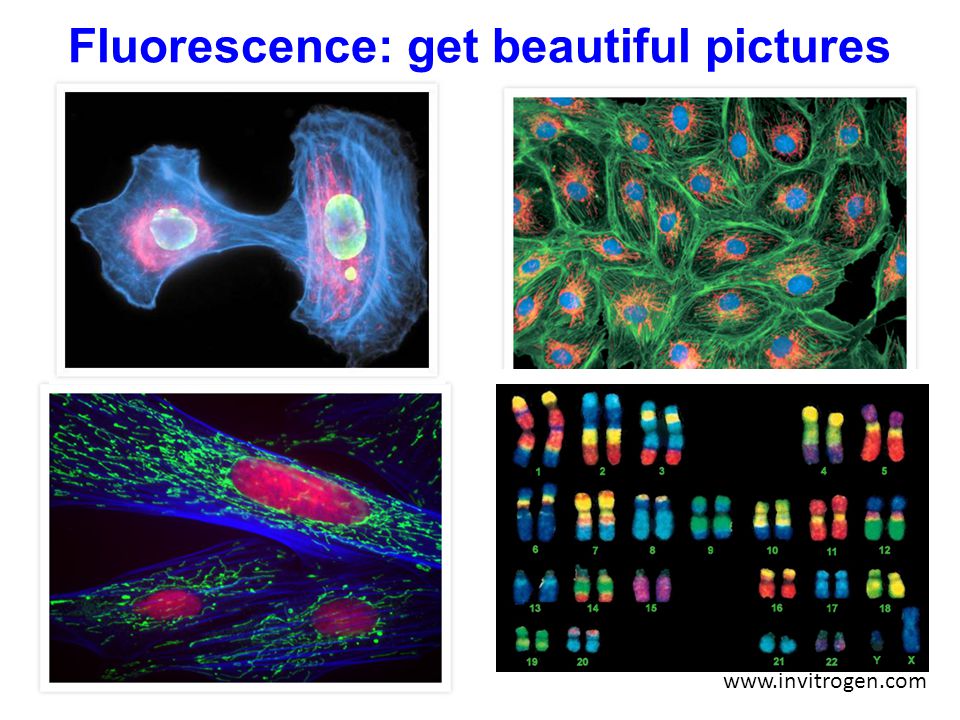
Fluorescence: get beautiful pictures
2
Lab 1: Bright Field and Fluorescence Optical Microscopy and Sectioning
Ensemble Fluorescence (Location - Loomis Selvin Lab; Instructor(s) - Marco Tjioe and/or another Selvin student) Part 1: Dye absorption, emission, lifetime, anisotropy Part 2: Bulk FRET, donor-acceptance donor Bright Field & Fluorescence Microscopy (Location – IGB; Instructor - Jaya Yodh) Part 1: Brightfield, Kohler illumination DIC, Phase Contrast, Color, Fluorescence Microscopy Part 2: Widefield fluorescence 3D stack and deconvolution ✔
 - Marco Tjioe and/or another Selvin student) Part 1: Dye absorption, emission, lifetime, anisotropy. Part 2: Bulk FRET, donor-acceptance donor. Bright Field & Fluorescence Microscopy (Location – IGB; Instructor - Jaya Yodh) Part 1: Brightfield, Kohler illumination DIC, Phase Contrast, Color, Fluorescence Microscopy. Part 2: Widefield fluorescence 3D stack and deconvolution. ✔")
3
Basic Set-up, Anisotropy (Polarization), FRET
Physics 598BP Today: Fluorescence What is it? Why is it good? Basic Set-up, Anisotropy (Polarization), FRET We spent about an hour on signal-to-noise in a dark-field experiment (for example, fluorescence), vs. a light field experiment. The bottom line is when you have a large background, you canNOT simply subtract it off to see a small signal. Just like you cannot see the stars during the day (where there is a lot of sunlight). That is because, with photons (and many other source), the noise of the background is proportional to the square root of the brightness. So, if you have Nbg photons of background, you will have Nbg1/2 of noise. As long as this is greater than Nsignal you can’t see the signal. Hence, with the stars, the amount of noise in the background is very large because sun is shining during the day, but is absent from the night. This becomes very clear with fluorescence. Fluorescenceis a dark field experiment, so with background so low, you can see very little signal, which means very low fluorescence. With a high numerical aperture objective (so you can collect all the light), you can even see single molecules! By absorption, which is a light-background experiment (i.e. with no sample you have a bright light, and then you are trying to measure the particles because they cause a decrease in the signal), it is very difficult to see a little amount. So we saw that by diluting a concentrated solution, 10,000 fold, we could still see it by fluorescence although the absorption was so small that we couldn’t see it by absorption.
, FRET. We spent about an hour on signal-to-noise in a dark-field experiment (for example, fluorescence), vs. a light field experiment. The bottom line is when you have a large background, you canNOT simply subtract it off to see a small signal. Just like you cannot see the stars during the day (where there is a lot of sunlight). That is because, with photons (and many other source), the noise of the background is proportional to the square root of the brightness. So, if you have Nbg photons of background, you will have Nbg1/2 of noise. As long as this is greater than Nsignal you can’t see the signal. Hence, with the stars, the amount of noise in the background is very large because sun is shining during the day, but is absent from the night. This becomes very clear with fluorescence. Fluorescenceis a dark field experiment, so with background so low, you can see very little signal, which means very low fluorescence. With a high numerical aperture objective (so you can collect all the light), you can even see single molecules! By absorption, which is a light-background experiment (i.e. with no sample you have a bright light, and then you are trying to measure the particles because they cause a decrease in the signal), it is very difficult to see a little amount. So we saw that by diluting a concentrated solution, 10,000 fold, we could still see it by fluorescence although the absorption was so small that we couldn’t see it by absorption.")
4
Photobleaching Important: Dye emits 105 107 photons, then dies!
What is fluorescence? Shine light in, gets absorbed, reemits at longer wavelength Stokes Shift ( nm) Excitation Spectra Emission Light In Light Out Thermal relaxation Fluorescence & Non-radiative Absorption Thermal relaxation [Femtosec] [Picosec] [Nanosec] Energy Time (nsec) Fluorescence -t/tf Y = e Photobleaching Important: Dye emits 105 107 photons, then dies!
 Excitation. Spectra. Emission. Light In. Light Out. Thermal. relaxation. Fluorescence. & Non-radiative. Absorption. Thermal relaxation. [Femtosec] [Picosec] [Nanosec] Energy. Time (nsec) Fluorescence. -t/tf. Y = e. Photobleaching Important: Dye emits 105 107 photons, then dies!")
5
Why fluorescence? Why so good?
Super-sensitive: see single fluorescent dye! Why? Answer: It’s a dark-field technique– shine light and w/o fluorophore being there, (ideally) see nothing. [Recall, that the noise associate with taking a measurement is proportional to how much there is: want to weigh something—it’s hard to do really precisely if object weighs a lot; easier to do if you’re weighing a light object. A bright-field technique has a lot of noise. 2. Lots of different labels for different objects. Get specificity and see many different objects on same sample. 3. Problem w fluorescence: must label with a fluorophore – sometimes, this is difficult/impossible.
 see nothing. [Recall, that the noise associate with taking a measurement is proportional to how much there is: want to weigh something—it’s hard to do really precisely if object weighs a lot; easier to do if you’re weighing a light object. A bright-field technique has a lot of noise. 2. Lots of different labels for different objects. Get specificity and see many different objects on same sample. 3. Problem w fluorescence: must label with a fluorophore. – sometimes, this is difficult/impossible.")
6
Fluorescence Microscopy
What is it? How does it compare in sensitivity to brightfield? Stokes Shift ( nm) Excitation Spectra Emission Use dyes which absorb at one wavelength and emit at their own wavelength. It’s MUCH more sensitive --in fact, can see down to a single molecule! Background is potentially ZERO! (It’s a dark-field technique) But signal is reasonably strong (ideally, get out one photon for every photon that you put in) With little background, can see very little, i.e. tremendously sensitive
 Excitation. Spectra. Emission. Use dyes which absorb at one wavelength and emit at their own wavelength. It’s MUCH more sensitive. --in fact, can see down to a single molecule! Background is potentially ZERO! (It’s a dark-field technique) But signal is reasonably strong. (ideally, get out one photon for every photon that you put in) With little background, can see very little, i.e. tremendously sensitive.")
7
Fluorophores & Quantum Yield q.y. = # photons out/photons in.
Have ≥ 1 electron that is free to move. Excitation light moves e’s around, i.e. a dipole, and it can re-radiate, often with polarization. Good dyes: QY ≈ 1; Absorption ≈ 100,000 cm-1M-1 ( A = ebc) Thermal relaxation Fluorescence (krad ) & Non-radiative (kn.r.) Absorption Thermal relaxation [Femtosec] [Picosec] Energy k = krad + kn.r. t = 1/k = trad + tn.r. QY = krad/(krad + kn.r)
 Thermal. relaxation. Fluorescence (krad ) & Non-radiative (kn.r.) Absorption. Thermal relaxation. [Femtosec] [Picosec] Energy. k = krad + kn.r. t = 1/k = trad + tn.r. QY = krad/(krad + kn.r)")
8
Fluorescence Polarization Dyes have an orientation (will absorb & emit in particular directions) Important for binding assays, FRET assays. 1. Dyes have a transition absorption dipole moment If light is polarized in direction of dipole, , will absorb light; if polarized perpendicular to light, it won’t absorb it. Signal proportional to sinQa, Qa is angle between light vector and dipole moment vector. 2. Once molecule is excited, then has probability of emitting, via an emission dipole moment, (which tends to be aligned with the absorption dipole moment). The probability that it will make it through the analyzer is sinQe, Qe is angle between emission dipole vector and analyzer. Coordinate system Excited fluorophores
. The probability that it will make it through the analyzer is sinQe, Qe is angle between emission dipole vector and analyzer. Coordinate system. Excited fluorophores.")
9
Polarization Can measure the average polarization (easiest),
Or the time-dependent (nanosecond lifetime) polarization (most informative)
 polarization (most informative)")
10
How to measure FP Anisotropy Polarization (0 to 0.5) (0 to 0.4)
perpendicular ( ) Anisotropy Polarization (0 to 0.5) (0 to 0.4) parallel ( ) Polarization & Anisotropy: Just slightly different forms Generally use Anisotropy because of simpler forms when time-dependent. Also simpler when have multiple components: A = SciAi where ci is the mole fraction of the ith component.
 Anisotropy. Polarization. (0 to 0.5) (0 to 0.4) parallel ( ) Polarization & Anisotropy: Just slightly different forms. Generally use Anisotropy because of simpler forms when time-dependent. Also simpler when have multiple components: A = SciAi where ci is the mole fraction of the ith component.")
11
Polarization vs. Anisotropy
Denominators with P, A Anisotropy Polarization The denominator of Anisotropy is simply the total light that would be observed if no polarizers were used. (Come in along x-axis.) Call Iz = I|| Call Iy = I Call Ix = I Ix+ Iy + Iz = 2 I + I|| P defined by analogy with dichroism ratio Non-polarized light (along x-axis) Break into Iz, Iy. Anisotropy is a more useful form for experimental data on complex systems Generally use Anisotropy because of simpler forms when time-dependent. Also simpler when have multiple components: A = SciAi where ci is the mole fraction of the ith component.
 Call Iz = I|| Call Iy = I. Call Ix = I. Ix+ Iy + Iz = 2 I + I|| P defined by analogy with dichroism ratio. Non-polarized light (along x-axis) Break into Iz, Iy. Anisotropy is a more useful form for experimental data on complex systems. Generally use Anisotropy because of simpler forms when time-dependent. Also simpler when have multiple components: A = SciAi where ci is the mole fraction of the ith component.")
12
FP set-up in a microscope
Anisotropy Perrin equation (Perrin, 1926): A0/A=1+6Dt, including the rotational diffusion coefficient (D), fluorescence lifetime (t) and, more significantly, the fundamental anisotropy (A0) which varies according to wavelength (Lakowicz, 1999; Weber & Shinitzky, 1970).
: A0/A=1+6Dt, including the rotational diffusion coefficient (D), fluorescence lifetime (t) and, more significantly, the fundamental anisotropy (A0) which varies according to wavelength (Lakowicz, 1999; Weber & Shinitzky, 1970).")
13
FP applied to binding

14
Competition monitored via FP Homogeneous Assays, no labeling competitors

15
Competition monitored by FP

16
FRET: measuring conformational changes of (single) biomolecules
FRET depends sharly on distance, R-6; useful for 20-80Å Distance dependent interactions between green and red light bulbs can be used to deduce the shape of the scissors during the function.

17
FRET is so useful because Ro (2-8 nm) is often ideal
Bigger Ro (>8 nm) can use FIONA, PAM. STORM -type techniques
 can use FIONA, PAM. STORM -type techniques.")
18
Fluorescence Resonance Energy Transfer (FRET)
Spectroscopic Ruler for measuring nm-scale distances, binding R (Å) E Ro 50 Å Energy Transfer Donor Acceptor Dipole-dipole Distant-dependent Energy transfer Time Time Look at relative amounts of green & red
 E. Ro 50 Å. Energy. Transfer. Donor. Acceptor. Dipole-dipole Distant-dependent. Energy transfer. Time. Time. Look at relative amounts. of green & red.")
19
Energy Transfer = function (kET, knd)
FRET : competition between donor deactivating by internal processes and by acceptor being nearby Energy Transfer Donor Acceptor Energy Transfer = function (kET, knd) E.T. = kET/(kET + knd) E.T. = 1/(1 + knd/kET) How is kET dependent on R? Kn.d. (Surprisingly,) it depends on R-6. kET E.T. = 1/(1 + knd/kET) = 1/(1 + knd/aR-6) = 1/(1 + R6 knd/a) E.T. = 1/(1 + (R6/Ro6)) = 1/(1 + (R/Ro)6) where Ro6 = E.T.-independent constants
 E.T. = kET/(kET + knd) E.T. = 1/(1 + knd/kET) How is kET dependent on R Kn.d. (Surprisingly,) it depends on R-6. kET. E.T. = 1/(1 + knd/kET) = 1/(1 + knd/aR-6) = 1/(1 + R6 knd/a) E.T. = 1/(1 + (R6/Ro6)) = 1/(1 + (R/Ro)6) where Ro6 = E.T.-independent constants.")
20
Energy Transfer goes like…
or ? Take limit…

21
The End

Similar presentations
 of molecular rotors maps.>")
 correction to last week’s lecture>")


 (Usually) Monday 4-5pm, 322 LLP This week only: Tuesday and Thursday, 1-3 (or.>")
, but how to study in cells? Do rafts really exist in cells? Are.>")
![Some structures Dansyl chloride 1,5-I-AEDANS Fluorescein isothiocyante ANS Ethidium bromide 5-[2-[(2-iodoacetyl)amino]ethylamino] naphthalene-1-sulfonic.](/15/4639132/big_thumb.jpg "Some structures Dansyl chloride 1,5-I-AEDANS Fluorescein isothiocyante ANS Ethidium bromide 5-[2-[(2-iodoacetyl)amino]ethylamino] naphthalene-1-sulfonic.>")


 How did 1 st week of labs go? Questions? Comments? Polarization assays—important for 2 and for binding assays (Lab 2)>")


, and contrast (seeing what you want to see). Both aspects have recently.>")
 of the Lorentz profile is the damping parameter, . For an isolated.>")


