Download presentation
Presentation is loading. Please wait.

3
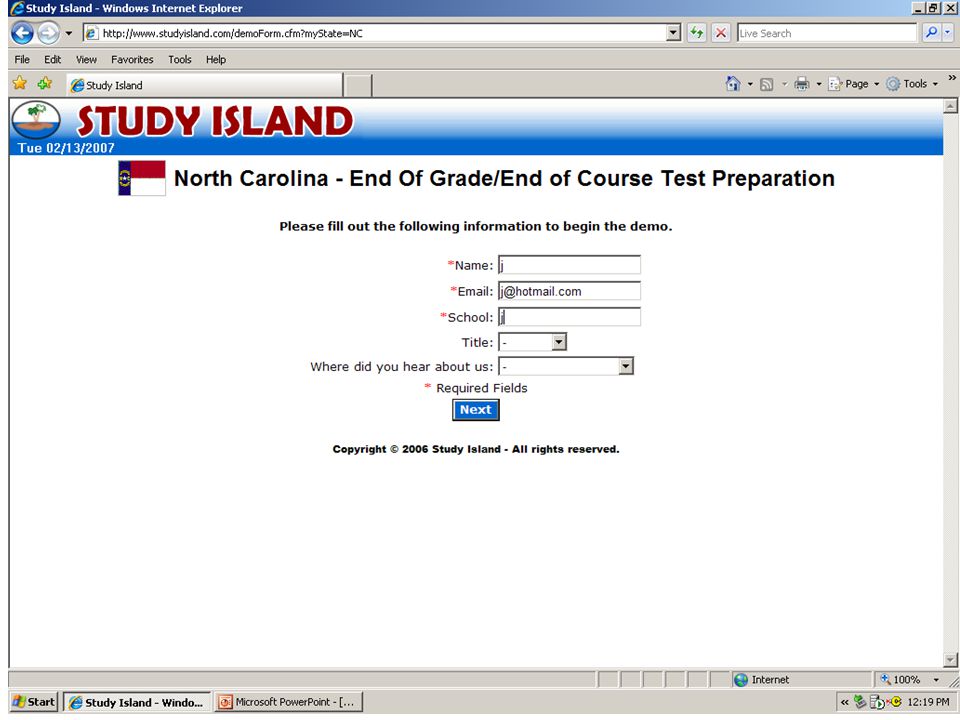
This is the main Study Island webpage If you are trying the free demo – select your state from the drop down box in the center of the screen. If you are already a user, you log in using your username and password over to the left hand side of the screen.

5
This shows the NC page We will click where it says Teachers ad Administrators Test Drive

7
If you are interested in getting information via email, enter your information. For training purposes today, we have entered a fake name and fake email address.

9
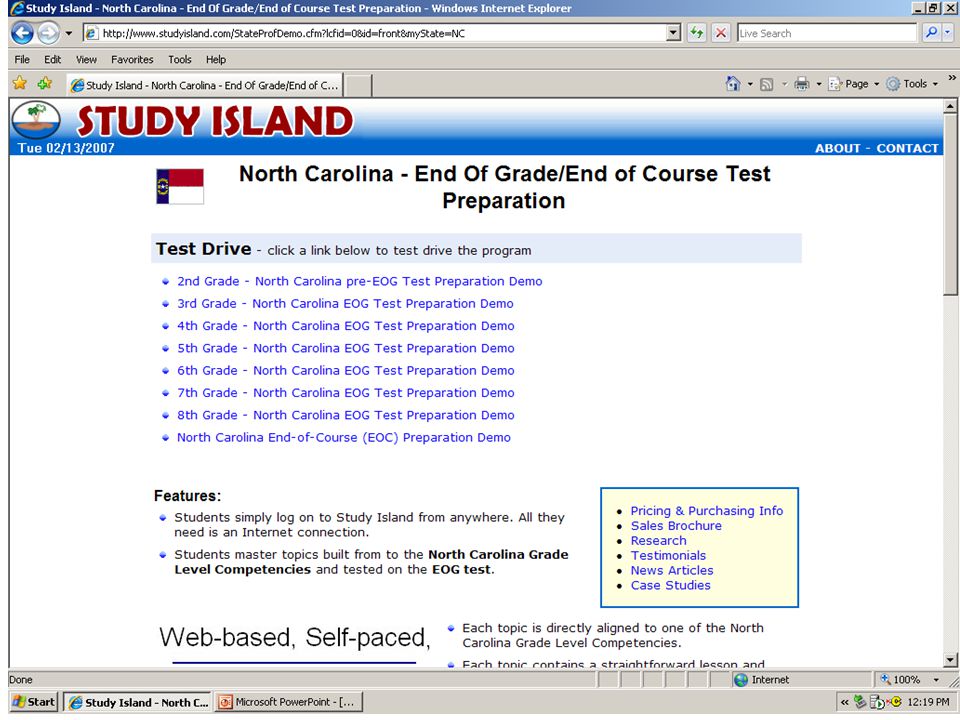
This screen shows you the different grade levels that are available within NC. You would need to choose a grade level We chose 4th grade

11
This is the same screen the students would see when they log in to Study Island. They just would not have the school stats and teacher options at the top left side. Here they can choose whichever subject(s) have been purchased. This person is not locked into 1 specific grade level – meaning they could access each of the grade levels. Teachers have rights to lock the grade level so students can only get to activities in their own grade level. You could leave it open to lower grade levels to use as a remediation tool (example ESL student in 4th grade but can’t read on 4th grade level may be able to do the 2nd grade reading sections.)
 have been purchased. This person is not locked into 1 specific grade level – meaning they could access each of the grade levels. Teachers have rights to lock the grade level so students can only get to activities in their own grade level. You could leave it open to lower grade levels to use as a remediation tool (example ESL student in 4th grade but can’t read on 4th grade level may be able to do the 2nd grade reading sections.).")
13
After choosing a grade level, you see this screen – your main menu page. This shows the subject you have chosen. Notice the grey tabs - you can go between subject by changing the tab you are viewing. Notice the subject is categorized by the goals and the objectives are underneath each goal. You can see that many of the objectives are crossed out, and this is only in the demo view. We don’t have full access. We will only be able to access the objectives that appear in red. You notice the word lesson that appears in blue next to each objective – you can click on this to see a mini- lesson on the objective You can get to an objective by either placing a check in the check box by the objective and then clicking Start Studying OR you can click on the name of the objective itself. If you use the check boxes, you can choose more than one objective to work on at a time. 4 columns: 1-goals and objectives to be covered, 2- Your results - the individual student’s cumulative session scores, 3- Passing Goal - the # of questions and the minimum score to earn the proficient ribbon, and 4-Grade – level I-IV

14
Student View

16
This is what one of the mini lessons looks like. Students can print these out to use as a reference. The teacher can print each lesson for each objective in each subject for each grade level and put them in a notebook to keep in the lab. Students could then use one for reference. When teachers brought their classes into the lab, they would use them as well.

18
This is the screen you see after you have chosen an objective. You can see here that we only chose 1 objective for this session. From this screen you can choose to complete the session in TEST MODE, one of the 10 GAME MODES, or as a printable WORKSHEET. You can also change the number of questions to work on.

20
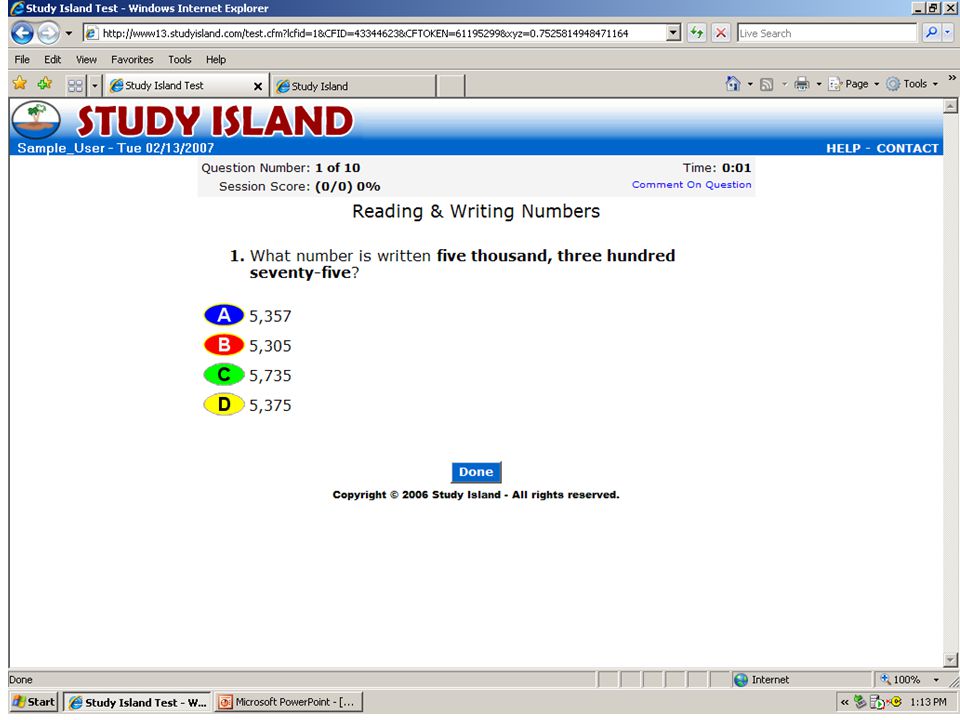
This is test mode The format is the same as with the EOG’s Students click on their answer choice IMMEDIATE FEEDBACK - It tells them if they are correct or wrong. If wrong, they can choose again. Notice the information displayed at the top of the screen: Question Number, Time, and Session Score This information is instantly updated as well.

22
Shows the first WRONG choice in red and then the correct answer with a star beside it.

24
Notice the session information at the top

26
This is what you see at the end of a session. You see this whether you completed the entire session or you clicked DONE to end it before completing all of the questions.

28
This screen is the main page for students. Notice the red triangles – after a student has completed a few sessions under a topic, and has not met proficiency, they will receive a red triangle directing the student to go to the building block topic just below the main topic After meeting proficiency for the building block topic, the student will receive a white ribbon, and may return to the main topic Notice the blue ribbon – this shows that a student has met proficiency for that topic

30
Now let’s take a look at the game modes. There are High score boards for each of the games under each of the skills in each subject for each grade level. There are 2 high score tables: 1 for your school and only users at your school, and the other list high scores for all of the Study Island users. Teachers often make a BIG deal out of students who make the ALL TIME HIGH Score table.

34
Skate Park game Click on the skateboard with the correct answer Then you will see the skating ramp – use the space bar and the arrow keys

36
First – drag the cannon ball with the correct answer over to the cannon Then you have to adjust the power and height levels to make the cannon shoot the ball to the target

38
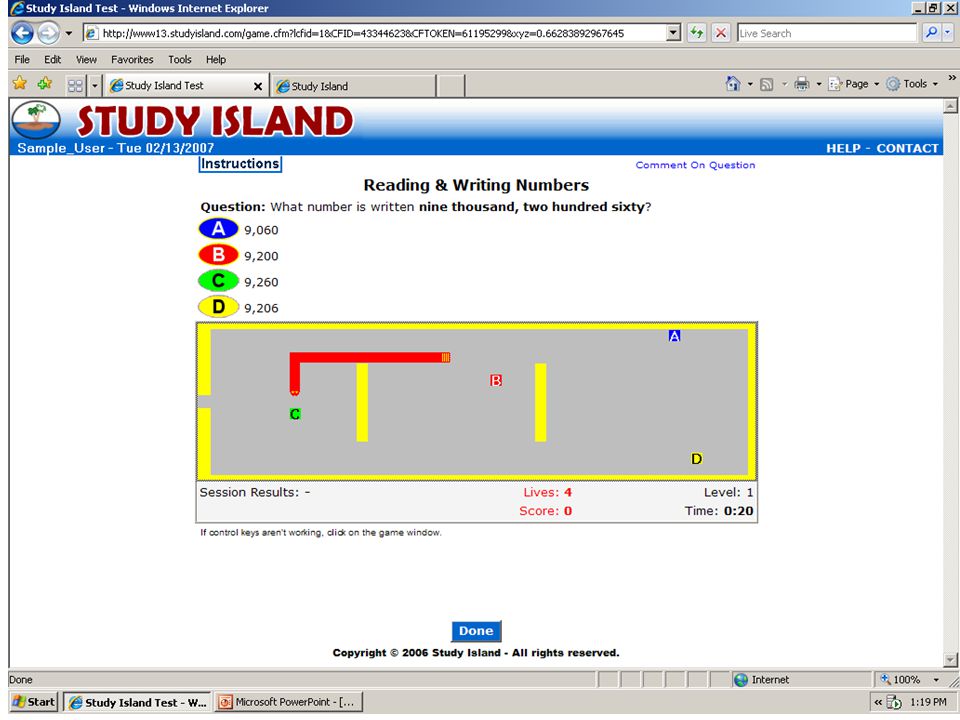
Splat game – much like frogger Make the mouse cross the road to the correct answer without getting hit by traffic

40
Use the arrow keys to direct the snake to the correct answer without bumping into the walls. The answers move around to make this game more challenging.

41
Use the arrow keys to direct the ship, and the space bar to shoot at the blimps.

42
Use the arrow keys to control the platform and try to catch the bouncing ball with the correct answer.

43
You have to use the arrow keys to direct the ladybug to the correct answer and then take it back to the base area before the bird catches you. The answers move around on this game too to make it more challenging.

44
You have to use the arrow keys to chase down the correct answer. The answers move around in this game.

46
Worksheet mode You can choose more than 1 objective, and you can choose the number of questions. Students will not get an answer page when they are logged in and print. Teachers who are logged in and print WILL get an answer page.

48
This is a sample of what a student would see if they clicked on reading report or math report over to the left. It looks a lot like the main page, but students can click on compare with others or suggested topics at the top. If they click on any of the blue scores, they will be brought to this next screen – a sessions screen.

49
This is a List of Sessions screen that shows each time a student has worked on this particular objective. You will see the session dates, and the type of session whether it was test mode or game mode. Time – amount of time spent for this session Questions – number completed % correct

51
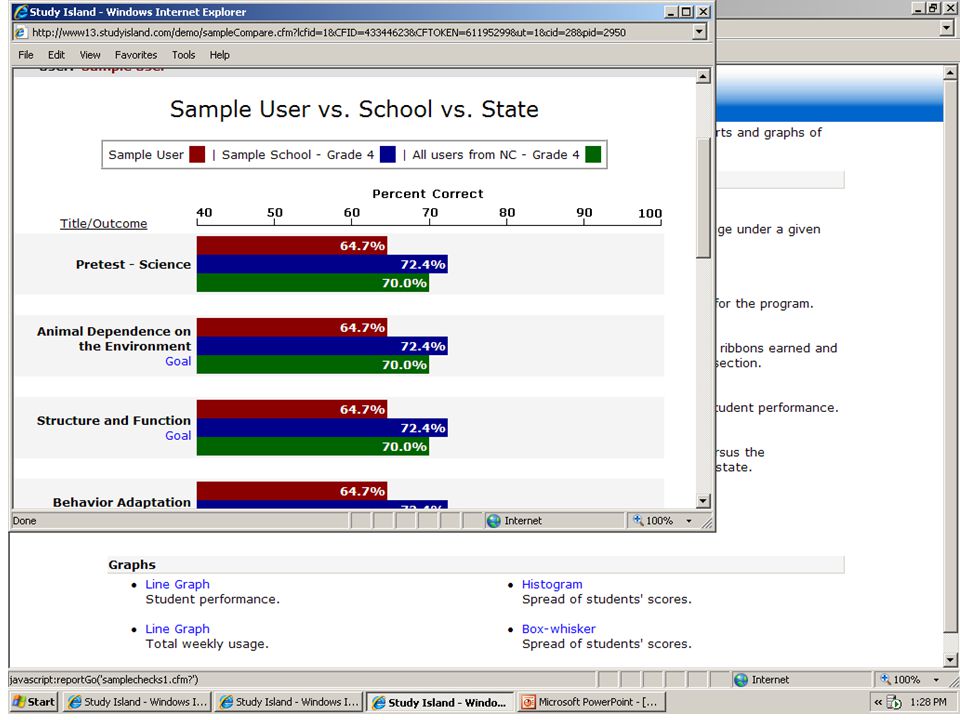
This is what students would see if they clicked on Compare With Others It compares them to others in the school and others in NC

53
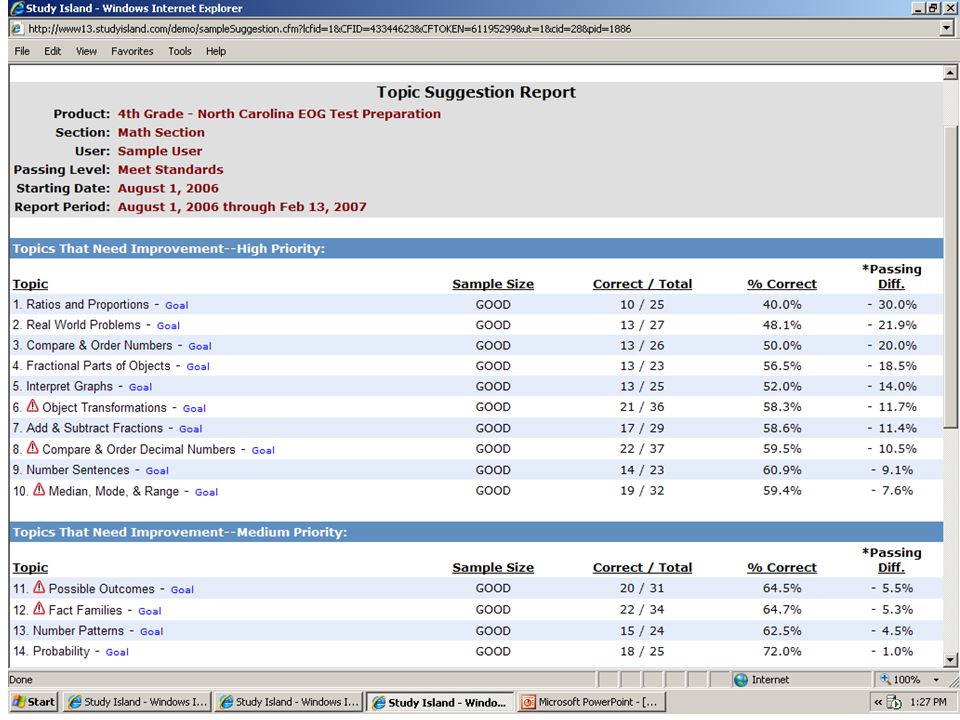
Topic suggestion report First part is what needs to be worked on high priority, medium priority, and have been met

54
Teacher View

55
In the demo mode, this is how you access the different reports, just to take a look.

57
Blue Ribbon Report This report is available to school personnel only (not parents or students). This report shows a group of students and their % complete and total ribbons awarded in a particular subject. This report is available for any group of students and shows data for all available subjects. This report is extremely versatile as it allows a user (teacher/administrator) to access the individual results of ANY student in ANY subject with one mouse click (The report below was generated by clicking the 5% under Julie Becker in reading.). This report is truly a “springboard” to each student’s individual performance broken down by objective for a particular subject (see below).
 to access the individual results of ANY student in ANY subject with one mouse click (The report below was generated by clicking the 5% under Julie Becker in reading.). This report is truly a springboard to each student’s individual performance broken down by objective for a particular subject (see below)..")
59
Individual Student Report This report allows a user to review an individual’s performance on each specific objective in a subject (in this case, it is reading for a 4th grade student). This report is available for all subjects and objectives. This report is able to be generated by school personnel as well as by the student themselves and their parents (students and parents may view only their own). This report allows for users to target specific weaknesses and strengths in a student’s learning and allows for a more targeted instructional path. Users may also click the # of sessions for a particular objective and receive the specifics of that session including the questions missed (see below- List of Sessions Report and Missed Questions Report). This report also contains a secondary report at the bottom that indicates strengths and weaknesses in question stem (cognition, interpretation, critical stance, and connections) as well as overall results (see below- Question Type Report).
. This report allows for users to target specific weaknesses and strengths in a student’s learning and allows for a more targeted instructional path. Users may also click the # of sessions for a particular objective and receive the specifics of that session including the questions missed (see below- List of Sessions Report and Missed Questions Report). This report also contains a secondary report at the bottom that indicates strengths and weaknesses in question stem (cognition, interpretation, critical stance, and connections) as well as overall results (see below- Question Type Report)..")
61
List of Sessions Report This report can be generated from an individual student’s report and lists the specifics (session type, time, # of questions completed, % complete) for each session the student has completed. This report is available for all subjects and objectives. The view missed button shows the specific questions a student missed in a session (see directly below). This report is available to school personnel and the student/parents. Student/parents can only view their own. Teachers also have the ability to remove sessions if needed by checking a particular session and then clicking the remove button in the upper left (parents and students cannot do this!).
. This report is available to school personnel and the student/parents. Student/parents can only view their own. Teachers also have the ability to remove sessions if needed by checking a particular session and then clicking the remove button in the upper left (parents and students cannot do this!)..")
63
Topic Suggestion Report DRIVES YOUR INSTRUCTION REPORT This report can be generated from any student or classrooms individual report. This report analyzes the performance on each objective for that individual student or classroom and organizes the performance into priority status. This report is available for any subject and lists specifically the objectives that need re-teaching and remediation and those that the student is gaining or has gained mastery. Hence my title “Drive Your Instruction Report”. This report is available to school personnel and the student/parents. Student/parents can only view their own.

65
Compare with others report This report can be generated from any student or classroom individual report. This report shows how a specific student or classroom (red bar) compares to the overall grade level at a school (blue bar) and the overall score from all users in that grade level statewide (green bar) in every objective in a particular subject. This report is available in all subjects. This report is more server intensive and updates twice a day. This report is available to school personnel and the student/parents. Student/parents can only view their own.
 compares to the overall grade level at a school (blue bar) and the overall score from all users in that grade level statewide (green bar) in every objective in a particular subject. This report is available in all subjects. This report is more server intensive and updates twice a day. This report is available to school personnel and the student/parents. Student/parents can only view their own..")
67
Objective grade Book Report by subject This report is available to school personnel only (no parents or students). This report shows a group of students and their results on every objective in a particular subject (in this case science). This report is available for any group of students and for any available subject at each school. The scores in any objective can be ranked for ease of use by clicking the blue score button below the desired objective. This is a great report to view by grade level or classroom as it provides immediate feedback to assist in organizing remediation/re-teaching and enrichment groups.
. This report is available for any group of students and for any available subject at each school. The scores in any objective can be ranked for ease of use by clicking the blue score button below the desired objective. This is a great report to view by grade level or classroom as it provides immediate feedback to assist in organizing remediation/re-teaching and enrichment groups..")
70
Performance trend graph This report is able to be generated by school personnel only. This report shows performance over time for all subjects available to a grade level. This report is a great way for administrators to track grade level growth throughout the year. This report is updated weekly.

72
Usage Trend Graph This report is able to be generated by school personnel only. This report shows usage over time for all subjects available to a grade level. This report is a great way for administrators to track the usage of their Study Island investment. This report is updated weekly.

74
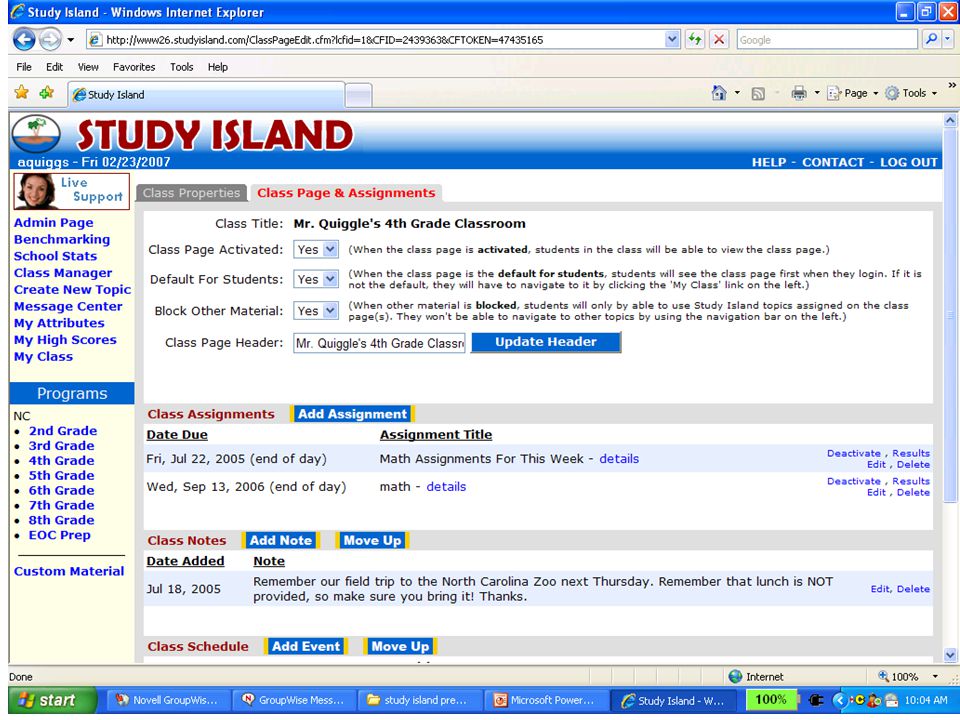
Teachers can create class pages for the students. If a class page has been created and activated, student in that particular class will see this screen when they log in to Study Island. On this class page, teachers can assign particular topics for their students to work on.

76
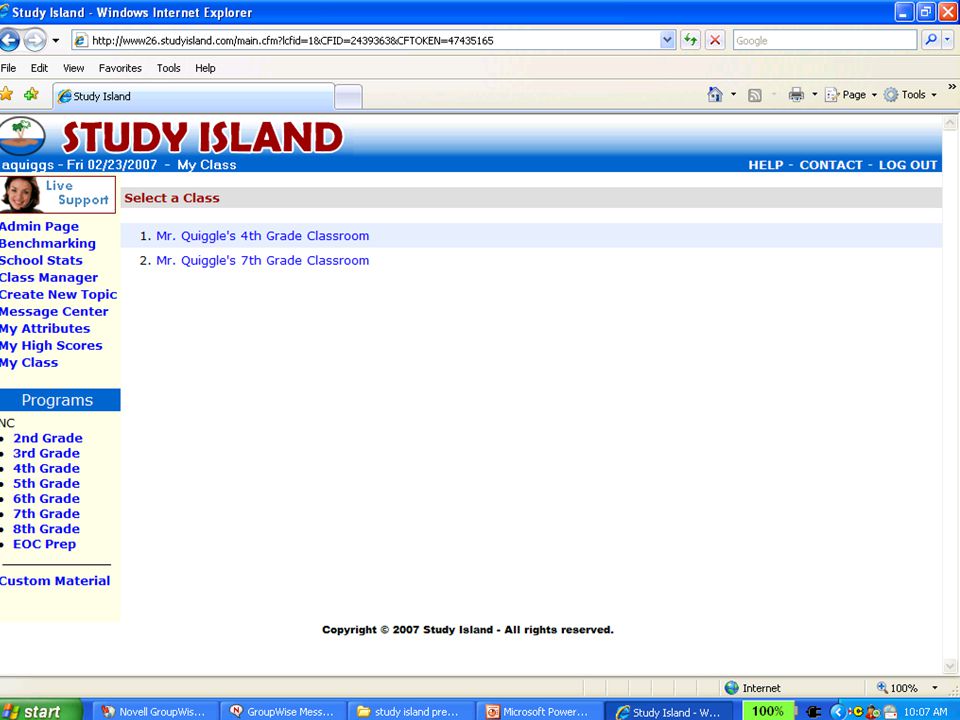
Students can be enrolled in more than one class. For example a particular may be enrolled in their regular homeroom and their tutoring group, EC class, ESl class, etc. This is what the student would see if they were enrolled in more than one class. The student would then have to choose which class page to view. The student’s work/data will appear under both classes.

78
This is the student view of a class page. The student would then select an assignment title.

80
Students can click on individual topics and begin working from this screen.

81
This slide show was created by Jackie Parker and Kathy Beck for training purposes and presentation at a state wide conference Updated 2009

Similar presentations


 November/December 2013 Accountability Services (12-11-13) 1.>")

