Download presentation
Presentation is loading. Please wait.

1
Criando testes usando randomizações

2
m = c(120,107,110,116,114,111,113,117,114,112) > f = c(110,111,107,108,110,105,107,106,111,111) boxplot(m,f, names = c("machos", "fêmeas"))
 > f = c(110,111,107,108,110,105,107,106,111,111) boxplot(m,f, names = c( machos , fêmeas ))")
4
require(boot) media = function(x,i)mean(x[i]) bootm = boot(m, media, 1000)
![require(boot) media = function(x,i)mean(x[i]) bootm = boot(m, media, 1000)](http://images.slideplayer.com/1/292468/slides/slide_4.jpg "require(boot) media = function(x,i)mean(x[i]) bootm = boot(m, media, 1000)")
5
plot (bootm)
")
7
> names(bootm) [1] "t0" "t" "R" "data" "seed" "statistic" [7] "sim" "call" "stype" "strata" "weights"
![> names(bootm) [1] t0 t R data seed statistic [7] sim call stype strata weights](http://images.slideplayer.com/1/292468/slides/slide_7.jpg "> names(bootm) [1] t0 t R data seed statistic [7] sim call stype strata weights")
8
hist(bootm$t, xlab =NULL, main = NULL )
")
10
hist(bootm$t, xlab ="comprimento do crânio", ylab = "freqüência",main = "Machos", freq = F ) > curve (dnorm(x, mean = 113.4, sd=3.7178),lwd = 3, add = T)
 > curve (dnorm(x, mean = 113.4, sd=3.7178),lwd = 3, add = T)")
13
cranio = data.frame(m,f) > cranio m f 1 120 110 2 107 111 3 110 107 4 116 108 5 114 110 6 111 105 7 113 107 8 117 106 9 114 111 10 112 111
 > cranio m f")
14
dmf = function (x,i)mean(cranio$m[i])-mean(cranio$f[i]) > bootdmf= boot(cranio,dmf, 1000) > boxplot (bootdmf$t, ylab= "diferença de comprimentos")
![dmf = function (x,i)mean(cranio$m[i])-mean(cranio$f[i]) > bootdmf= boot(cranio,dmf, 1000) > boxplot (bootdmf$t, ylab= diferença de comprimentos )](http://images.slideplayer.com/1/292468/slides/slide_14.jpg "dmf = function (x,i)mean(cranio$m[i])-mean(cranio$f[i]) > bootdmf= boot(cranio,dmf, 1000) > boxplot (bootdmf$t, ylab= diferença de comprimentos )")
16
hist(bootdmf$t, xlab ="diferença de comprimento do crânio", main = NULL, freq = F ) curve (dnorm(x, mean = 4.8, sd=1.329), add = T) curve (dnorm(x, mean = 0, sd=1.329), lwd = 3, col = 2, add = T, pch = 4)
 curve (dnorm(x, mean = 4.8, sd=1.329), add = T) curve (dnorm(x, mean = 0, sd=1.329), lwd = 3, col = 2, add = T, pch = 4)")
20
bootdmf ORDINARY NONPARAMETRIC BOOTSTRAP Call: boot(data = cranio, statistic = dmf, R = 1000) Bootstrap Statistics : original bias std. error t1* 4.8 -0.0274 1.329382

21
pmf = function (x,i)mean(cranio$m[i])/mean(cranio$f[i]) > bootpmf= boot(cranio,pmf, 1000) > bootpmf ORDINARY NONPARAMETRIC BOOTSTRAP Call: boot(data = cranio, statistic = pmf, R = 1000) Bootstrap Statistics : original bias std. error t1* 1.044199 -0.0002888062 0.01231848
![pmf = function (x,i)mean(cranio$m[i])/mean(cranio$f[i]) > bootpmf= boot(cranio,pmf, 1000) > bootpmf ORDINARY NONPARAMETRIC BOOTSTRAP Call: boot(data = cranio, statistic = pmf, R = 1000) Bootstrap Statistics : original bias std.](http://images.slideplayer.com/1/292468/slides/slide_21.jpg "error t1*")
22
quantile(bootpmf$t, c(0.01, 0.99)) 1% 99% 1.013604 1.071238 > min(bootpmf$t) [1] 1.00271
![quantile(bootpmf$t, c(0.01, 0.99)) 1% 99% > min(bootpmf$t) [1]](http://images.slideplayer.com/1/292468/slides/slide_22.jpg "quantile(bootpmf$t, c(0.01, 0.99)) 1% 99% > min(bootpmf$t) [1]")
23
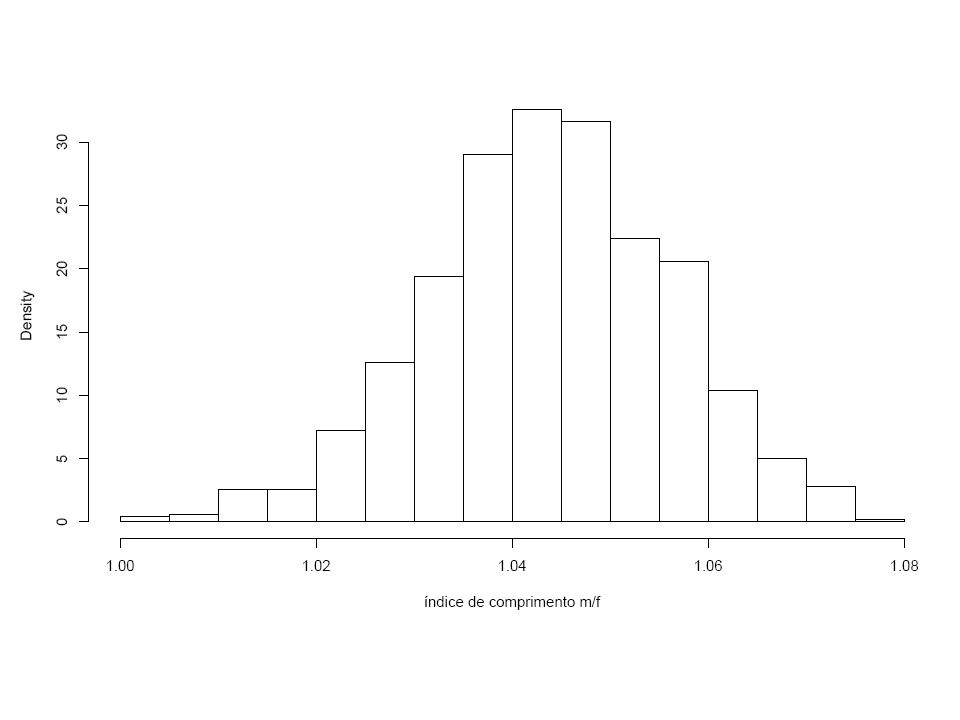
hist(bootpmf$t, xlab ="índice de comprimento m/f", main = NULL, freq = F ) > curve (dnorm(x, mean = 1, sd=0.01231848), add = T)
 > curve (dnorm(x, mean = 1, sd= ), add = T)")
26
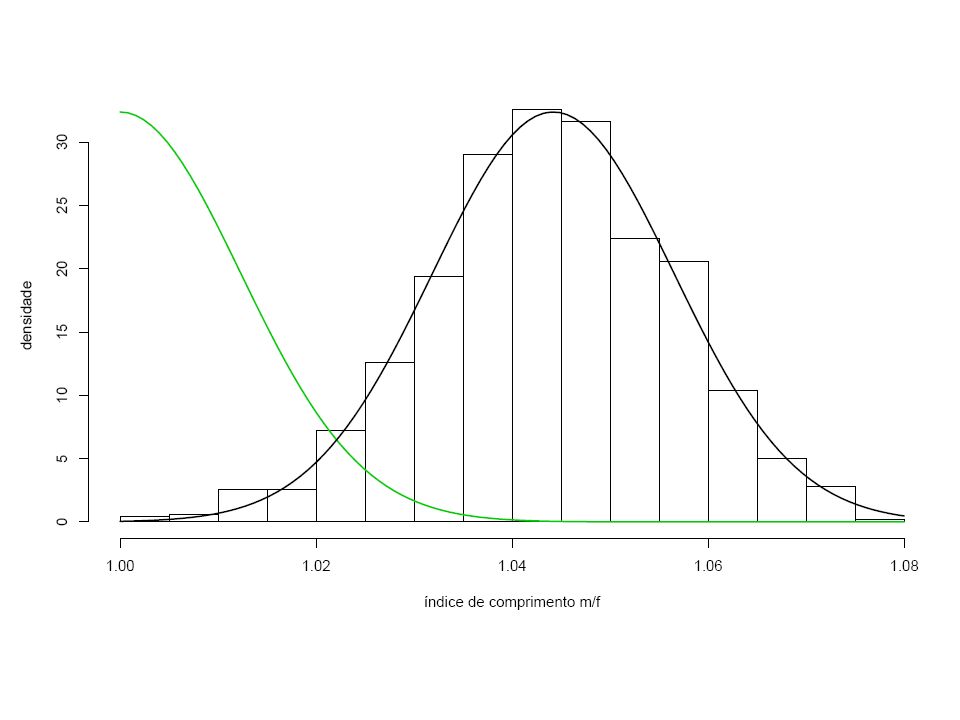
> hist(bootpmf$t, xlab ="índice de comprimento m/f",ylab = "densidade", main = NULL, freq = F ) > curve (dnorm(x, mean = 1, sd=0.01231848), lwd = 2, col = 3,add = T) > curve (dnorm(x, mean = 1.044199, sd=0.01231848), lwd = 2, col = 1,add = T)
 > curve (dnorm(x, mean = 1, sd= ), lwd = 2, col = 3,add = T) > curve (dnorm(x, mean = , sd= ), lwd = 2, col = 1,add = T)")
Similar presentations


![[1] Confidence Intervals. [2] Statistical Estimation sample statistic = parameter estimate = s=s= Example:](/1/260994/big_thumb.jpg "[1] Confidence Intervals. [2] Statistical Estimation sample statistic = parameter estimate = s=s= Example:>")


 98. How did Mayella.>")