Download presentation
Presentation is loading. Please wait.

3
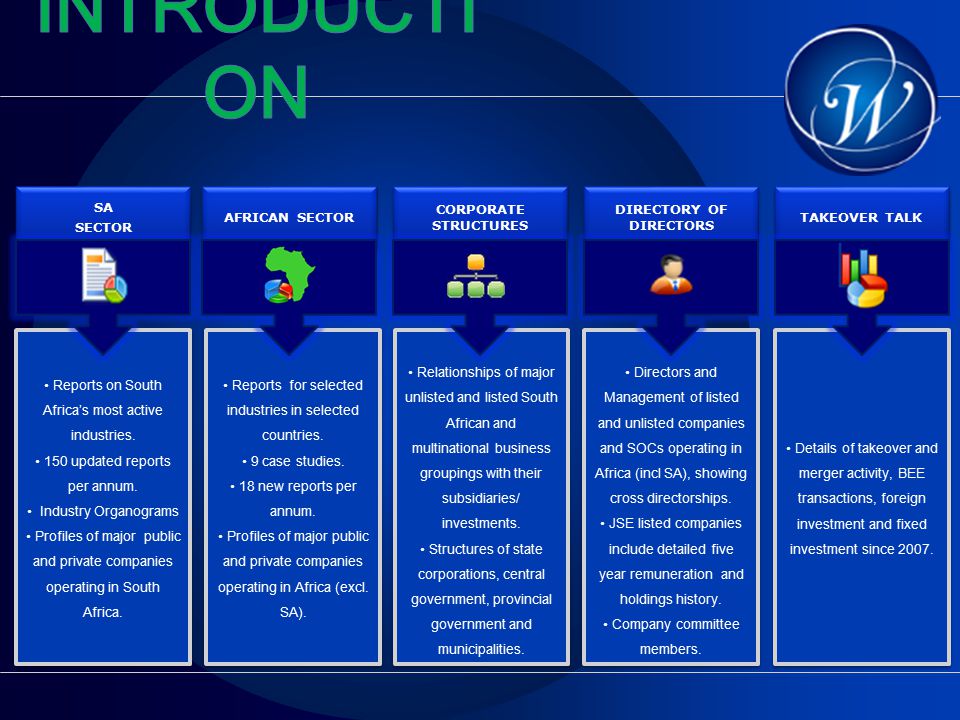
SA SECTOR SA SECTOR Reports on South Africa’s most active industries. 150 updated reports per annum. Industry Organograms Profiles of major public and private companies operating in South Africa. Reports on South Africa’s most active industries. 150 updated reports per annum. Industry Organograms Profiles of major public and private companies operating in South Africa. AFRICAN SECTOR Reports for selected industries in selected countries. 9 case studies. 18 new reports per annum. Profiles of major public and private companies operating in Africa (excl. SA). Reports for selected industries in selected countries. 9 case studies. 18 new reports per annum. Profiles of major public and private companies operating in Africa (excl. SA). CORPORATE STRUCTURES Relationships of major unlisted and listed South African and multinational business groupings with their subsidiaries/ investments. Structures of state corporations, central government, provincial government and municipalities. Relationships of major unlisted and listed South African and multinational business groupings with their subsidiaries/ investments. Structures of state corporations, central government, provincial government and municipalities. TAKEOVER TALK Details of takeover and merger activity, BEE transactions, foreign investment and fixed investment since 2007. DIRECTORY OF DIRECTORS Directors and Management of listed and unlisted companies and SOCs operating in Africa (incl SA), showing cross directorships. JSE listed companies include detailed five year remuneration and holdings history. Company committee members. Directors and Management of listed and unlisted companies and SOCs operating in Africa (incl SA), showing cross directorships. JSE listed companies include detailed five year remuneration and holdings history. Company committee members.
. Reports for selected industries in selected countries. 9 case studies. 18 new reports per annum. Profiles of major public and private companies operating in Africa (excl. SA). CORPORATE STRUCTURES Relationships of major unlisted and listed South African and multinational business groupings with their subsidiaries/ investments. Structures of state corporations, central government, provincial government and municipalities. Relationships of major unlisted and listed South African and multinational business groupings with their subsidiaries/ investments. Structures of state corporations, central government, provincial government and municipalities. TAKEOVER TALK Details of takeover and merger activity, BEE transactions, foreign investment and fixed investment since DIRECTORY OF DIRECTORS Directors and Management of listed and unlisted companies and SOCs operating in Africa (incl SA), showing cross directorships. JSE listed companies include detailed five year remuneration and holdings history. Company committee members. Directors and Management of listed and unlisted companies and SOCs operating in Africa (incl SA), showing cross directorships. JSE listed companies include detailed five year remuneration and holdings history. Company committee members..")
5
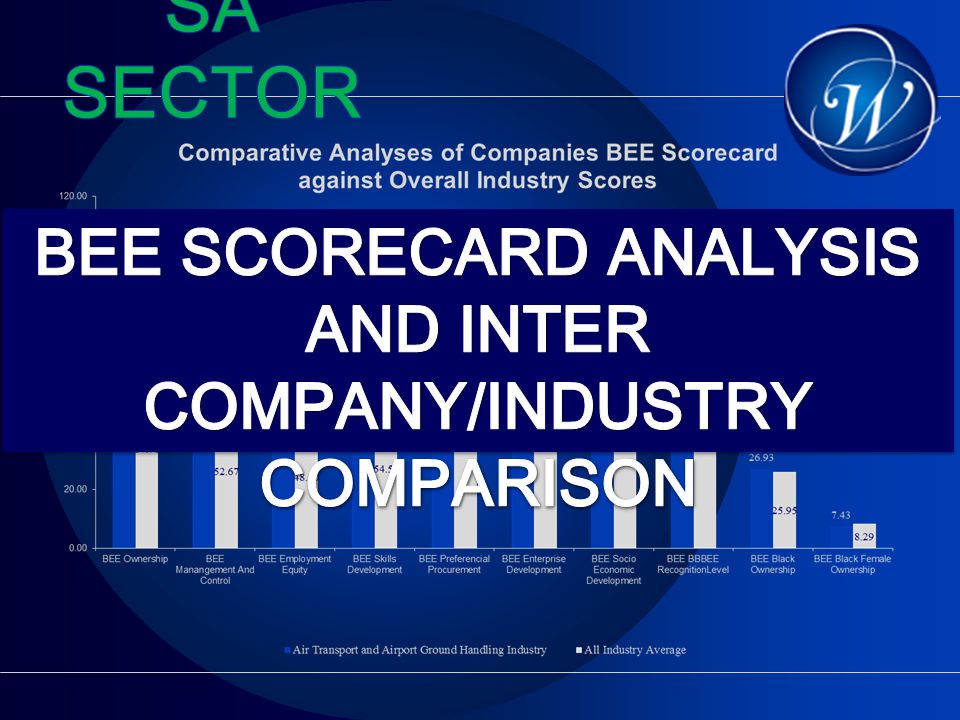
Key Points Database of South African Business Research conducted at 5-digit SICCODE level Over 5 300 companies, 90% of which are unlisted Industry Information on 231 SubSectors Peer and Market Analysis BEE Industry Benchmarks CSI Initiatives

7
1.INTRODUCTION 2.DESCRIPTION OF THE INDUSTRY 2.1.Industry Supply Chain 2.2.Geographic Position 3.SIZE AND STRUCTURE OF THE INDUSTRY 4.STATE OF THE INDUSTRY 4.1.Local 4.1.1.Corporate Actions 4.1.2.Regulations & Government Programmes 4.1.3.Enterprise Development and Social Economic Development 4.2.Continental 4.3.International 5.INFLUENCING FACTORS 5.1.Government Intervention 5.2.Labour 5.3.Economic Environment 5.4.Rising Input Costs 5.5.Cyclicality 5.6.Information Technology 5.7.Technology 5.8.Environmental Concerns 5.9.Epidemiological Concerns 5.10.Safety, Security and Crime 6.COMPETITION 6.1.Barriers to Entry 6.2.Innovation and R&D 7.SWOT ANALYSIS 8.FUTURE OUTLOOK 9.INDUSTRY ASSOCIATIONS 10.REFERENCES 10.1.Publications 10.2.Websites AIR TRANSPORT AND AIRPORT GROUND HANDLING SERVICES Siccodes 74110 and 74134

9
Trading As Reg number VAT number BEE Rating Contact information Divisions Shareholders Active Directors and designations Active Management Inactive Directors History of Business SA Sector Company Profile Nature of business No. of employees Company secretary Banks Auditors Turnover Estimated profit Company year end Corporate risk management in the Industry Subsidiaries, Associates and Investments

13
Key Points Focuses on industries in the other countries on the African continent at the five digit SICC level. Market penetration and African footprint of South African and multi-national companies. Over 3 600 company reports which include: South African company subsidiaries in Africa. The approximately 1000 companies listed on the African exchanges (ex JSE). Other large local and multinational unlisted companies. Industry reports in selected countries.
. Other large local and multinational unlisted companies. Industry reports in selected countries..")
17
Key Points Maintains ownership relationships of over 160 000 companies. Shows African and International footprint of South African companies, showing direct, indirect and intermediate holdings. Shows foreign companies invested in South Africa and Africa. Ascertains: Group Exposure Size of Company GROUP INTERMEDIATE HOLDING COMPANY SUBSIDIARY INTERMEDIATE HOLDING COMPANY SUBSIDIARY

20
COMPANY NAME SHAREHOLDERS CORPORATE STRUCTURE COMPANY PROFILES SUBSIDIARIES DOMICILE COUNTRY ENTITY TYPE LISTED UNLISTED

23
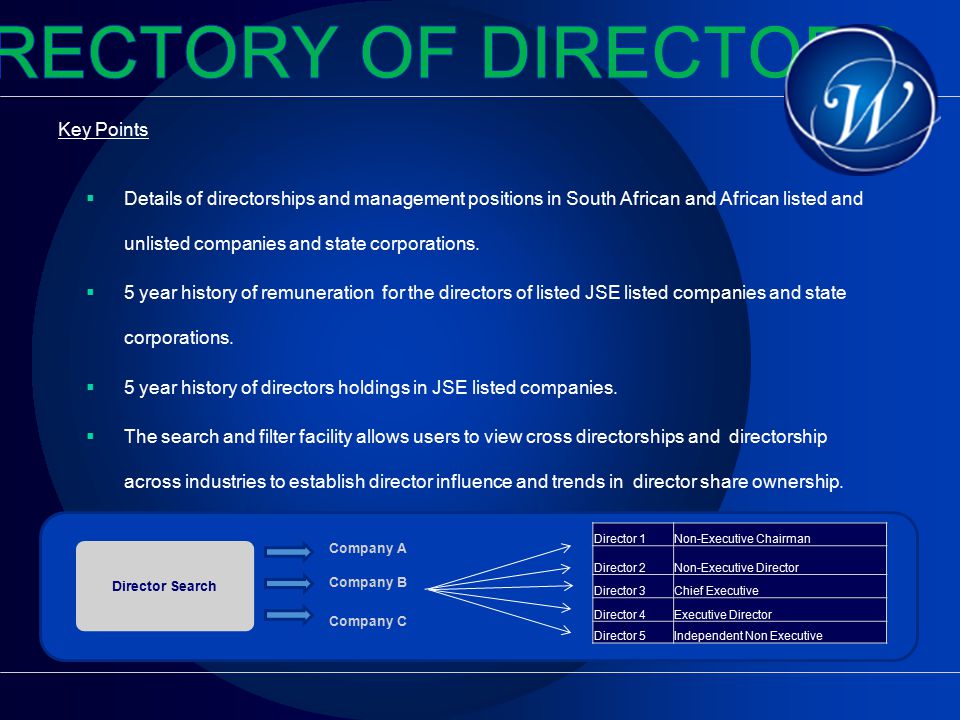
Key Points Details of directorships and management positions in South African and African listed and unlisted companies and state corporations. 5 year history of remuneration for the directors of listed JSE listed companies and state corporations. 5 year history of directors holdings in JSE listed companies. The search and filter facility allows users to view cross directorships and directorship across industries to establish director influence and trends in director share ownership. Director Search Company A Company B Company C Director 1Non-Executive Chairman Director 2Non-Executive Director Director 3Chief Executive Director 4Executive Director Director 5Independent Non Executive

25
Directory of Directors DIRECTORS COMPANY PROFILES REMUNERATION COMMITTEES SENIOR MANAGEMENT DIRECTORS HOLDINGS

26
Director Search Company A Company B Company C 25 Director 1Non-Executive Chairman Director 2Non-Executive Director Director 3Chief Executive Director 4Executive Director Director 5Independent Non Executive Company X Company Y Company Z Director 1Non-Executive Chairman Director 2Non-Executive Director Director 3Chief Executive Director 4Executive Director Director 5Independent Non Executive

28
Key Points Weekly record of M&A activity, key appointments and investment in new capacity, which is linked to all relevant databases. Includes research into FDI activity into and out of Africa since 2007 and black empowerment transactions. Identify who is coming in Most popular destinations Most popular industries FDI into and out of Africa

31
Mergers & Acquisitions, Investments, Key Position Movements Directors and Management. Earnings and Holdings of JSE Listed Companies and SOCs Company Committees Key SA Industry Report Companies operating in SA Industry Organograms African Industry Reports Companies operating in Africa Ownership Relationships Global SA Footprint International Footprint SA SECTOR DIRECTORY OF DIRECTORS TALKOVER TALK CORPORATE STRUCTURES AFRICAN SECTOR

32
who owns whom who owns whom twitter For more information please visit us on: facebook

Similar presentations


 Changing the Government Agenda of EU's poorest countries using the power.>")
 Foreign direct.>")


 M. Hakan ZOBU, CMC.>")


