Download presentation
Presentation is loading. Please wait.

1
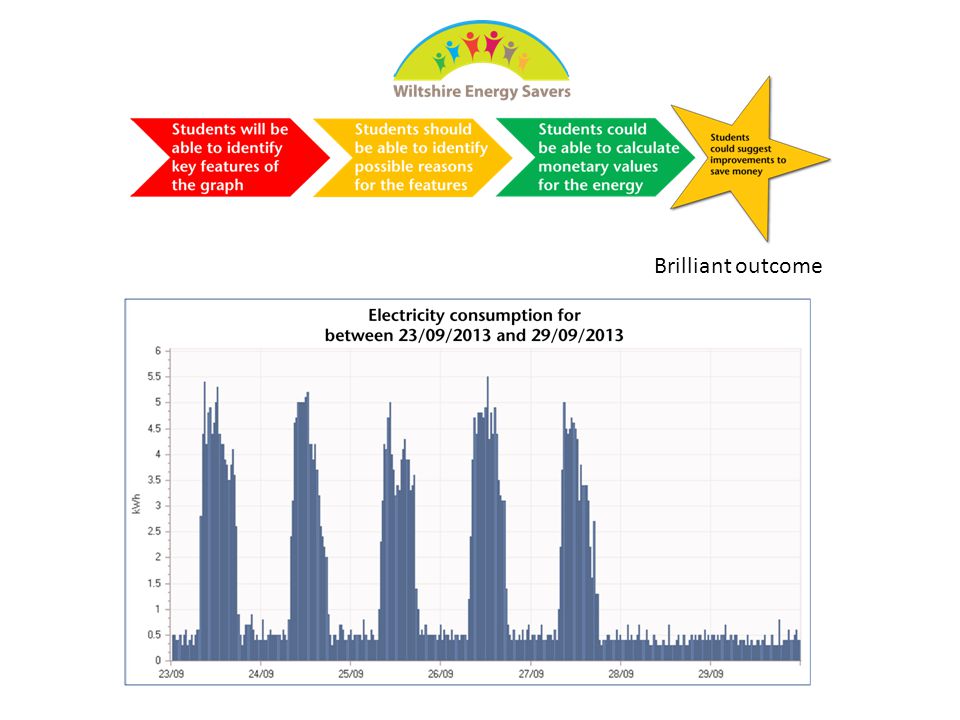
Analysing energy graphs Learning Objective Be able to analyse a graph and relate the key features to real world events Brilliant outcome

2
What would you spend £500 on? What could the school spend £500 on?

3
Starter Brilliant outcome What does it mean when we have... IkW

4
1 kilo-watt hour (1kWh) is the energy used by a 1kW device over 1 hour For example boiling a kettle for 1 hour 1 kWh costs about 10p Brilliant outcome
 is the energy used by a 1kW device over 1 hour For example boiling a kettle for 1 hour 1 kWh costs about 10p Brilliant outcome")
5
Example

6
1. Use the Prompt cards on the desk to ask questions about the graph 2.Answer the questions on the worksheet provided. Try to be as descriptive as you can Daily Weekly Monthly Brilliant outcome Your turn Extension: Use the space on your worksheet to make suggestions on how the school could change to improve energy efficiency Key words Compare Decrease Because Increase Anually Kilowatt hour (kwh)
.")
7
Brilliant outcome

11
What could we do to save money and be more efficient?

12
In L centre on 1 day we think we could save... Calculation In L block in 1 day we can save............................................................................................................................. If 1 kWh cost 10p this is the same as..................................................................................................................... Across all of the blocks in the school this would mean....................................................................................... For all 190 days we are at school this would mean............................................................................................. Brilliant outcome What could we do to save money and be more efficient?

13
Brilliant outcome

Similar presentations


 = Energy Transferred (joules) Time (seconds) This means the more powerful something is, the more energy is.>")


>")
>")

 1100W 65W 1800W 2000W.>")


 Electrical Power Electrical Energy.>")
 = Power (kW) x Time.>")


