Download presentation
Presentation is loading. Please wait.

1
By Sandeep Tripathi IFS DIRECTOR (Research) Indian Council of Forestry Research and Education Dehra Dun “Addressing Impacts of Climate Change: Global Experience” 18– 09 – 2009 WII,Dehradun
 Indian Council of Forestry Research and Education Dehra Dun Addressing Impacts of Climate Change: Global Experience 18– 09 – 2009 WII,Dehradun")
2
Our climate is changing In a irreversible direction On an increasingly faster rates Mainly due to anthropogenic reasons

3
Source: IPCC, 2007, WGI Report

4
(280 in 1750 to 379 ppm) (715 in 1750 to 1774 ppb) (270 in 1750 to 319 ppb)
 (715 in 1750 to 1774 ppb) (270 in 1750 to 319 ppb)")
5
(a)-global emission 1970-2004, (b)-share of GHG gases, (c) sectoral shares
-global emission , (b)-share of GHG gases, (c) sectoral shares")
6
Global mean temperatures are rising faster with time 100 0.074 0.018 50 0.128 0.026 Warmest 12 years: 1998,2005,2003,2002,2004,2006, 2001,1997,1995,1999,1990,2000 Period Rate Years /decade

7
Since 1993, global average sea level has risen at an average rate of 3.1 mm/yr Since 1993, global average sea level has risen at an average rate of 3.1 mm/yr

8
Projections of Future Climate Best estimate for low scenario (B1) is 1.8°C (likely range is 1.1°C to 2.9°C), and for high scenario (A1FI) is 4.0°C (likely range is 2.4°C to 6.4°C).
 is 1.8°C (likely range is 1.1°C to 2.9°C), and for high scenario (A1FI) is 4.0°C (likely range is 2.4°C to 6.4°C).")
9
Projections of Future Climate

10
Projected Future Impacts of Climate Change Global surface warming over the 21 st century - 2 o C to 4.5 o C Global surface warming over the 21 st century - 2 o C to 4.5 o C Increase in precipitation in high latitudes, and likely decreases in most subtropical land regions continues Increase in precipitation in high latitudes, and likely decreases in most subtropical land regions continues Contraction of snow cover area /Glaciers continue to recede Contraction of snow cover area /Glaciers continue to recede Sea level rise – 0.02 m by middle, and 0.15 m by 21st century Sea level rise – 0.02 m by middle, and 0.15 m by 21st century Ocean acidification with reduction in ocean pH of between 0.14 and 0.35 units over the 21st century Ocean acidification with reduction in ocean pH of between 0.14 and 0.35 units over the 21st century Decrease in freshwater availability- Drought Decrease in freshwater availability- Drought River basins – increased flood hazard, from 1.4-1.6 billion in 1995 to 4.3-6.9 billion in 2050 River basins – increased flood hazard, from 1.4-1.6 billion in 1995 to 4.3-6.9 billion in 2050 Coastal areas, small islands and low lying areas are key hotspots of societal vulnerability (intense tropical cyclones) Coastal areas, small islands and low lying areas are key hotspots of societal vulnerability (intense tropical cyclones) Source: IPCC (2007)
 Coastal areas, small islands and low lying areas are key hotspots of societal vulnerability (intense tropical cyclones) Source: IPCC (2007)")
11
IMPACT OF CLIMATE CHANGE ON FOREST ECOSYSTEMS Increased risk of extinction and loss of biodiversity –Approximately 20-30% of species at risk if warming exceeds 1.5 – 2.5 °C (relative to 1980-1999) –Approximately 40-70% of species at risk if warming exceeds above 3.5 °C On forests and forest functions –Migration of species, flowering, pollination, bird arrival Likely changes structure and functions - Diversity,maintenance, productivity, carbon sequestration, water cycling, etc. Enhanced natural disturbances such as fires, pests and extreme climatic events

12
Forests and Climate change Sinks: remove CO2 from the atmosphere –Forests and other terrestrial sinks absorb 2.6 GtC annually (AR4) –ICFRE estimates Indian forests absorb 38 mtc annually Reservoirs: keep carbon as biomass –According to FAO estimates forests store about 638 GtC –ICFRE estimates Indian forests stock 6.6 Gtc Sources: releases gases like carbon dioxide and methane when forests are destroyed –Deforestation and other land-use activities emit 1.6 GtC annually (AR4) –Forest sector, mostly deforestation, accounts for 17 % of the total anthropogenic GHG emissions
 –ICFRE estimates Indian forests absorb 38 mtc annually Reservoirs: keep carbon as biomass –According to FAO estimates forests store about 638 GtC –ICFRE estimates Indian forests stock 6.6 Gtc Sources: releases gases like carbon dioxide and methane when forests are destroyed –Deforestation and other land-use activities emit 1.6 GtC annually (AR4) –Forest sector, mostly deforestation, accounts for 17 % of the total anthropogenic GHG emissions")
13
IPCC 4 th Assessment Report Share of different sectors in total anthropogenic GHG emissions in 2004 in terms of CO 2 equivalent Energy Supply25.9% Industry 19.4% Forestry17.4% Agriculture13.5% Residential and 7.9% Commercial building Waste and Wastewater2.8%

14
Carbon Stocks in 1995- 6,245 million tonnes Carbon Stocks in 2005- 6,662 million tonnes Annual Increment of 38 mt of C or 138 mt of CO2 Valuation of carbon Stock-24000mt CO2 -Rs. 6,000,000 crore @$US5 Incremental Value of Carbon Stocks- Rs.6,000 crore Sequestration Potential of Indian Forests and Trees

15
Climate Change: Adaptation Strategies ADAPTION- RESPONSE TO CLIMATE CHANGE BY ADAPTING TO ITS IMPACTS Only Win-Win & No Regret Options be considered Improved Tree Varieties & Clones Develop drought & pest resistance in commercial tree species Develop fire and insect management practices Improved Land Management/rotation/harvesting Biodiversity conservation by multi-species plantations Rationalize PA Boundaries/ Corridors

16
Forestry Based Mitigation Options MITIGATION- Stabilization of Co2 in atmosphere Reduced Deforestation/Stabilization- Slowing or stopping loss of existing forests: preserving current C reservoirs Afforestation & Reforestation- Carbon Sequestration by adding to the planets vegetative cover: enlarging living terrestrial C reservoirs. Forest Management- Improved productivity, Increasing the C stored in C reservoirs such as agricultural soils and harvested wood products. Bio-Energy- Substituting sustainable biomass energy sources for fossil fuel consumption

17
The United Nations Framework convention on Climate Change (UNFCCC) 1988: UN Intergovernmental Panel on Climate Change (IPCC) –Established by UN to assess technical information June 1992: Rio “Earth Summit” UN Framework Convention on Climate Change (UNFCCC) –21 March 1994 - entry into force
 1988: UN Intergovernmental Panel on Climate Change (IPCC) –Established by UN to assess technical information June 1992: Rio Earth Summit UN Framework Convention on Climate Change (UNFCCC) –21 March entry into force")
18
The Kyoto Protocol Adopted in Kyoto, COP 3, 1997 after two and half years of negotiations with support of 141 nations without USA and Australia The Kyoto Protocol of United Nations Framework Convention on Climate Change (UNFCCC) enforced on 16 th February 2005 38 industrialized countries have ratified the treaty and are legally bound to reduce their green house gas emission (GHG) by 5.2 % before 2012 with targets set for each nations based on their 1990 level
 enforced on 16 th February industrialized countries have ratified the treaty and are legally bound to reduce their green house gas emission (GHG) by 5.2 % before 2012 with targets set for each nations based on their 1990 level")
19
1990 2000 2010 2005 2002 Kyoto Protocol Starts C emission Levels Under UNFCCC 2008-2012- 5.2%

20
MARKET BASED MECHANISMS (i)Emission Trading( Article 17): Allow the developed countries to transfer emissions credits to each other (ii)Joint Implementation (Article 6): Implemented between two developed (Annex 1) countries. Credits obtained by investing countries are offset by debits to the country hosting the Project (iii)The Clean Development Mechanism (Article 12 )
The Clean Development Mechanism (Article 12 ).")
21
To promote sustainable development by encouraging investments by Governments and Private firms in environmental friendly projects in developing countries that reduce or avoid emission. Implemented between Annex I and Non-Annex I countries in the geographic territory of Non-Annex countries Developed countries receive credit against their targets for emissions avoided by these projects. The Clean Development Mechanism (CDM)-Article 12
-Article 12.")
22
How CDM operates As a result of Kyoto Protocol carbon has become a tradable commodity Any entity (foreign, domestic, joint venture, public, corporate, non-profit) may set up a project to produce any good (e.g. steel) or any service (e.g. transportation), in a non-Annex I Party One Tonne of CO 2 reduced through a CDM Project is known as a Certified Emission Reduction (CER) when issued by CDM EB and transferred to the buyer in Annex-I country which can be traded
 or any service (e.g. transportation), in a non-Annex I Party One Tonne of CO 2 reduced through a CDM Project is known as a Certified Emission Reduction (CER) when issued by CDM EB and transferred to the buyer in Annex-I country which can be traded.")
23
COP 10 Buenos Aires (Dec, 2004): Adopted simplified Modalities and Procedures for Small Scale A&R Projects Small scale project activities under CDM are expected to result in net anthropogenic GHG removals by sinks of <8kt of CO 2 (Now 16 kt post Bali) annually and are developed or implemented by low-income communities and individuals Small Scale A&R Projects
: Adopted simplified Modalities and Procedures for Small Scale A&R Projects Small scale project activities under CDM are expected to result in net anthropogenic GHG removals by sinks of <8kt of CO 2 (Now 16 kt post Bali) annually and are developed or implemented by low-income communities and individuals Small Scale A&R Projects")
24
To reduce transaction costs, modalities and procedures are simplified for small-scale A&R projects under CDM: Bundling allowed for PDD, validation, registration, monitoring, verification & certification Requirements of PDD reduced Simplified baseline methodologies Monitoring plans & requirements simpler Same DOE may undertake validation, verification & certification

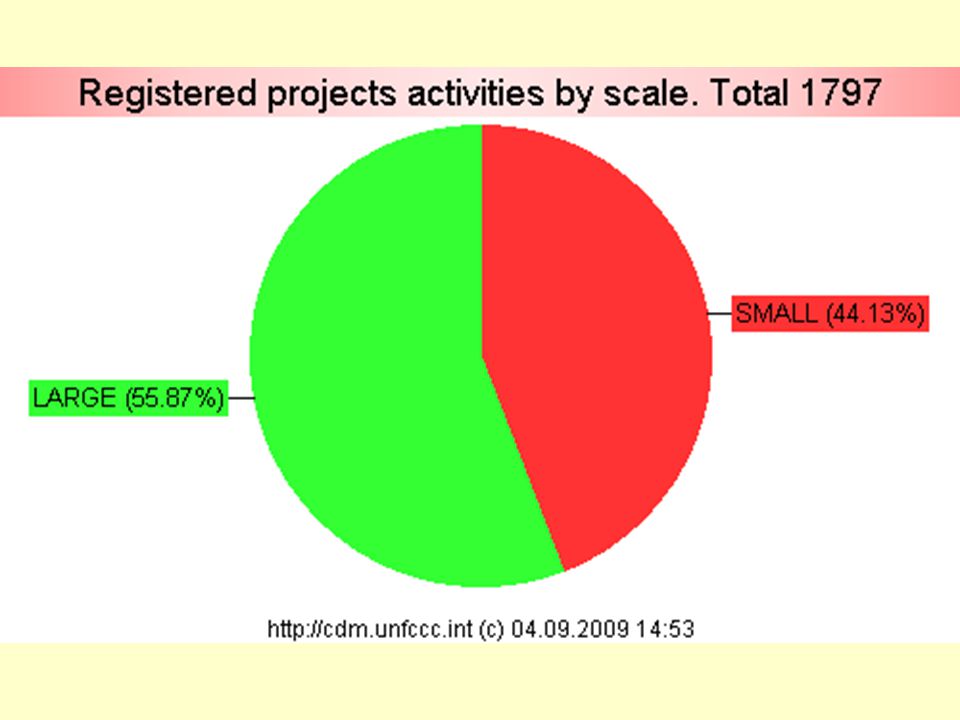
25
CDM project pipeline: > 3000 Registered: 1764 Requesting registration: 50 A&R (Forestry): 35 methodologies submitted 10 methodologies approved 3 Small Scale A&R methodology approved 5 A&R Project registered
: 35 methodologies submitted 10 methodologies approved 3 Small Scale A&R methodology approved 5 A&R Project registered")
32
Steps for CDM Project Approval Develop Project Idea Note Seek Project Development Funding Engage Designated Operational Entity Creation of Project Design Document Host Country Letter of Approval Designated Operational Entity to validate PDD Project Registration verification and issuance of CERs

33
Host Country Approval NCDMA Single window clearance Submit the Project Concept Note (PCN) and Project Design Document (PDD). NCDMA examines the Project Once the Authority is satisfied, Project conforms to the norms governing the CDM, Host Country Approval (HCA) issued Submission of PCN and PDD with 2 CDs to NCDMA Circulation among NCDMA members Presentation by Project Developed during NCDMA meeting Clarification / additional information from Project Development if required by NCDMA members Host country approval letter NCDMA meets once in a month
 issued Submission of PCN and PDD with 2 CDs to NCDMA Circulation among NCDMA members Presentation by Project Developed during NCDMA meeting Clarification / additional information from Project Development if required by NCDMA members Host country approval letter NCDMA meets once in a month.")
34
CDM Project cycle Project Design and Formulation (PCN & PDD) National Approval Validation/ Registration Project Financing Monitoring Verification and Certification DOE Investor DOE CDM-EB/Registry PDD Project participant Monitoring Report Verification/Certification/ request for CER ActivityReports Institutions DNA Issuance of CERs
 National Approval Validation/ Registration Project Financing Monitoring Verification and Certification DOE Investor DOE CDM-EB/Registry PDD Project participant Monitoring Report Verification/Certification/ request for CER ActivityReports Institutions DNA Issuance of CERs")
35
PROJECT DESIGN DOCUMENT FORM FOR AFFORESTATION AND REFORESTATION PROJECT ACTIVITIES (CDM-AR-PDD) CONTENTS A. General description of the proposed A/R CDM project activity B. Duration of the project activity / crediting period C. Application of an approved baseline and monitoring methodology D. Estimation of ex ante net anthropogenic GHG removals by sinks and estimated amount of net anthropogenic GHG removals by sinks over the chosen crediting period E. Monitoring plan F. Environmental impacts of the proposed A/R CDM project activity G. Socio-economic impacts of the proposed A/R CDM project activity H. Stakeholders’ comments This template shall not be altered. It shall be completed without modifying/adding headings or logo, format or font.

36
Technological/Methodological Issues Additionality –Physical –Financial Baseline scenario Leakage Land Eligibility Bundling and PoA

37
ADDITIONALITY A project activity is “additional” or “not additional”. Accordingly it gets 100% or 0% of the carbon credits. Under the Kyoto Protocol “additionality” is a “yes” or “no” judgment.

38
Carbon Time = Estimation of what may occur under the CDM ex ante = Estimation of what would otherwise occur Only the “additional carbon” has a potential market value. Additional carbon Project crediting period Project carbon Baseline carbon ex ante BASELINE STUDY Baseline study – ex ante (Projection)
.")
39
Nearby the Project AreaProject Area Leakage = Increased GHG emissions outside the project boundary attributable to the project activity (e.g. induced land use/cover change, increased consumption of fossil fuels) and measurable.Leakage 2005 2005+ X CO 2 2005+X C C The method to be used to assess leakage is part of the “baseline” methodology.
 and measurable.Leakage X CO X C C The method to be used to assess leakage is part of the baseline methodology..")
40
Outside the project boundary, “attributable” and “measurable” Within the project boundary = “Actual net GHG removal by sinks” Carbon benefits of A/R CDM project activities Project scenario changes in the carbon stocks in the carbon pools) = “Baseline net GHG removal by sinks” Baseline scenario (changes in the carbon stocks in the carbon pools) (decrease in the carbon stocks in the carbon pools) increase in emissions = “Net anthropogenic GHG removal by sinks” = Leakage
 = Baseline net GHG removal by sinks Baseline scenario (changes in the carbon stocks in the carbon pools) (decrease in the carbon stocks in the carbon pools) increase in emissions = Net anthropogenic GHG removal by sinks = Leakage")
41
“Forest” is a minimum area of land of 0.05 – 1.0 ha with tree crown cover of 10 – 30 per cent trees with the potential to reach a minimum height of 2 – 5 meters For land use, land-use change and Forestry activities following definitions shall apply:

42
Forest Definition India's original Forest definition: Tree crown Cover 10-30% (30%) Tree Height: 2-5 m(5m) Minimum area: 0.05-1 ha(0.05ha) Serious thought was given to this issue and changes were recommended: UNFCCC changed the country forest definition as follows: Tree crown Cover (15%) Tree Height: (2m) Minimum area: (0.05ha)
 Tree Height: 2-5 m(5m) Minimum area: ha(0.05ha) Serious thought was given to this issue and changes were recommended: UNFCCC changed the country forest definition as follows: Tree crown Cover (15%) Tree Height: (2m) Minimum area: (0.05ha)")
43
(a) “Afforestation” is direct human- induced conversion of land that has not been forested for a period of at least 50 years to forested land through planting, seeding and/or the human-induced promotion of natural seed sources
 Afforestation is direct human- induced conversion of land that has not been forested for a period of at least 50 years to forested land through planting, seeding and/or the human-induced promotion of natural seed sources")
44
(b) “ Reforestation” is direct human- induced conversion of non-forested land to forested land, that did not contain forest on 31 December 1989,through planting, seeding and/or the human-induced promotion of natural seed sources
 Reforestation is direct human- induced conversion of non-forested land to forested land, that did not contain forest on 31 December 1989,through planting, seeding and/or the human-induced promotion of natural seed sources")
45
CountryFor afforestation and reforestation project activities - Host Party's selected single minimum: Tree crown cover value between 10 and 30 % Land area value between 0.05 and 1 hectare Tree height value between 2 and 5 metres 1Albania300.1 3 2Cambodia3015 3China200.0672 4Colombia3015 5Costa Rica3015 6Dem Rep of the Congo3015 7Honduras3015 8India30 ( 15%)0.055 ( 2 ) 9Nicaragua2014 10Republic of Moldova300.255 11Uganda301.05 12Viet Nam300.53 13Yemen300.53 Country Forest definition for CDM AR projects
0.055 ( 2 ) 9Nicaragua Republic of Moldova Uganda Viet Nam Yemen Country Forest definition for CDM AR projects")
46
Bundling and PoA Bundling-Bringing together of several small- scale CDM project activities, without the loss of distinctive characteristics of each project activity. Verification by one DOE Programme of activities (PoA)-Registration of local/regional/national policies or standards as CDM project activities by voluntary implementation of such policies by stakeholders / organizations/individuals
-Registration of local/regional/national policies or standards as CDM project activities by voluntary implementation of such policies by stakeholders / organizations/individuals.")
47
CDM A&R Projects from India Sl. No. Name of the ProjectProject DeveloperCO2 Removal/ yr (kt) Size (ha) Remarks 1.Bagepalli CDM Afforestation Programme Women for Sustainable Development (WSD), Bangalore 8.01383Baseline Methodology not approved by CDM EB 2.The International small group and Tree Planting Programme Active TIST Small Group Tamil Nadu 51.62 million trees Not submitted to CDM EB 3.Improving Rural Livelihood through Carbon Sequestration by Adapting Environment Friendly technology Based Afforestation Practices VEDA MACS Hyderabad 20.03500Supported by WB Carbon Finance Yet submitted to CDM EB 4.Afforestation of the Cropland through Agroforestry Practices in 3658 Ha. Area in Khammam District of Andhra Pradesh, India under ITCs Farm Forestry Project ITC Bhadrachalam47.63658Approved by CDM EB 5.Small-scale Cooperative Afforestation CDM Pilot Project Activity on Private lands Affected by Shifting Sand Dunes in Sirsa, Haryana and The Haryana CDM Variksh Kisan Samiti. Haryana Forest Department 2.9369.5Approved by CDM EB
 Size (ha) Remarks 1.Bagepalli CDM Afforestation Programme Women for Sustainable Development (WSD), Bangalore Baseline Methodology not approved by CDM EB 2.The International small group and Tree Planting Programme Active TIST Small Group Tamil Nadu million trees Not submitted to CDM EB 3.Improving Rural Livelihood through Carbon Sequestration by Adapting Environment Friendly technology Based Afforestation Practices VEDA MACS Hyderabad Supported by WB Carbon Finance Yet submitted to CDM EB 4.Afforestation of the Cropland through Agroforestry Practices in 3658 Ha. Area in Khammam District of Andhra Pradesh, India under ITCs Farm Forestry Project ITC Bhadrachalam Approved by CDM EB 5.Small-scale Cooperative Afforestation CDM Pilot Project Activity on Private lands Affected by Shifting Sand Dunes in Sirsa, Haryana and The Haryana CDM Variksh Kisan Samiti. Haryana Forest Department Approved by CDM EB.")
48
Investment in CDM Projects

49
Potential opportunities for India.. As on March 2009 398 out of 1445 projects registered by EB are from India NCDMA has accorded host country approval to 1226 projects having an investment of Rs. 151,397 crores with a potential of 573 million CER having value of US $ 5.73 billion by 2012. Assuming 10% share of Sink Projects India can fetch US $500 million by 2012

50
International Carbon Market Trading Amount of Carbon Traded (Mt CO 2 )
")
51
Reducing Deforestation in Developing Countries First Deliberated in COP – 11 at Montreal 2005 Followed up by Workshops at Rome, Italy in August 2006 and Cairns, Australia in March 2007 In COP 12 at Nairobi, SBSTA 26 at Bonn India pleaded for incentives towards conservation measures also In COP -13 at Bali discussion on exiting & potential Policy Approaches, incentives & methodological issues In COP-14 at Poznan role on conservation, SMF & increase in forest cover recognized under- REDD + Draft text for COP-15 Copenhagen 2009

52
S. No. CountriesNumber of Countries Area 1,000 haAnnual Change 199020051,000 ha/ year % 1Non Annex Countries with increasing forest cover and other wooded lands 27 443,092479,624 2,436+0.55 2Non Annex Countries with decreasing forest cover and other wooded lands 74 2484,8852283,436 13,430- 0.54 3Countries with negligible or No change 90---- Change in extent of Forest Cover and wooded lands 1990-2005 (Excluding Annex I Countries, Data Source: FAO, 2005)
.")
53
Area (Million ha) Nations: Decreasing Forest Cover Top 15 Non Annex 1 Countries 154 47115 69 419 9586 27 201 56 180 166 9755 48 Numbers above the bars represent the years needed to reach zero forest cover with present rate of deforestation (from 2005) Source: FRA 2005 (FAO 2005)
 Nations: Decreasing Forest Cover Top 15 Non Annex 1 Countries Numbers above the bars represent the years needed to reach zero forest cover with present rate of deforestation (from 2005) Source: FRA 2005 (FAO 2005)")
54
Area (Million ha) Nations: Increasing Forest Cover Top 10 Non Annex 1 Countries Source: FRA 2005 (FAO, 2005)
 Nations: Increasing Forest Cover Top 10 Non Annex 1 Countries Source: FRA 2005 (FAO, 2005)")
55
Compensated Conservation suggested by India (2007) and supported by others REDD+ The Bali Action Plan calls for: “Policy approaches and positive incentives on issues relating to reducing emissions from deforestation and forest degradation in developing countries; and the role of conservation, sustainable management of forests and enhancement of forest carbon stocks in developing countries;”[FCCC/CP/2007/6/Add.1, 14 March 2008; Decision 1/CP.13 [BAP], paragraph 1(b)(iii)]
![Compensated Conservation suggested by India (2007) and supported by others REDD+ The Bali Action Plan calls for: Policy approaches and positive incentives on issues relating to reducing emissions from deforestation and forest degradation in developing countries; and the role of conservation, sustainable management of forests and enhancement of forest carbon stocks in developing countries; [FCCC/CP/2007/6/Add.1, 14 March 2008; Decision 1/CP.13 [BAP], paragraph 1(b)(iii)]](http://images.slideplayer.com/10/2815360/slides/slide_55.jpg "Compensated Conservation suggested by India (2007) and supported by others REDD+ The Bali Action Plan calls for: Policy approaches and positive incentives on issues relating to reducing emissions from deforestation and forest degradation in developing countries; and the role of conservation, sustainable management of forests and enhancement of forest carbon stocks in developing countries; [FCCC/CP/2007/6/Add.1, 14 March 2008; Decision 1/CP.13 [BAP], paragraph 1(b)(iii)]")
56
Incentives Claim: India Proposed policy approach of Compensated Conservation seeks incentive for 1.incremental stocks of 0.96 GtC between 2006-2030 (projected increase from 8.79 GtC in 2006 to 9.75 GtC in 2030) 2.baseline stocks of 8.79 GtC as on 2006
 2.baseline stocks of 8.79 GtC as on 2006")
57
NATIONALACTION PLAN ON CLIMATE CHANGE ( NAPCC)& OTHER INITIATIVES 8 MISSIONS IDENTIFIED Green India-Treating 5 million ha degraded forest land - Afforestation of 18 m ha wasteland by 12 FYP (2016-17) Annual target- 3.3 m ha( additional 2.2 mha) Financial target- Rs. 77,000/- crores (additional (@ Rs 50,000/- ha) Fund for Regeneration & Sustainable Development- Initial corpus of US$2.5 b and annual Budget of US$1b CAMPA Fund –Rs. 11,000/- crores Availing CDM benefit
 Fund for Regeneration & Sustainable Development- Initial corpus of US$2.5 b and annual Budget of US$1b CAMPA Fund –Rs. 11,000/- crores Availing CDM benefit.")
Similar presentations


 Results WG III Folie 1 A Short Overview of the IPCC Report on Climate Change Mitigation 2007 (WG III) Prof. Dr.>")

>")


>")


 sector Kevin Grose, Coordinator.>")


 The Clean Development Mechanism: Overview Topic.>")


