Download presentation
Presentation is loading. Please wait.

1
Covalent Bonding: Orbitals b

2
Copyright © Houghton Mifflin Company. All rights reserved. 14a–2 Figure 13.1: (a) The interaction of two hydrogen atoms (b) Energy profile as a function of the distance between the nuclei of the hydrogen atoms.
 The interaction of two hydrogen atoms (b) Energy profile as a function of the distance between the nuclei of the hydrogen atoms..")
3
Copyright © Houghton Mifflin Company. All rights reserved. 14a–3 Figure 13.1: (a) The interaction of two hydrogen atoms (b) Energy profile as a function of the distance between the nuclei of the hydrogen atoms.
 The interaction of two hydrogen atoms (b) Energy profile as a function of the distance between the nuclei of the hydrogen atoms..")
4
Copyright © Houghton Mifflin Company. All rights reserved. 14a–4 Figure 14.25: The combination of hydrogen 1s atomic orbitals to form MOs

5
Copyright © Houghton Mifflin Company. All rights reserved. 14a–5 10.6

6
Copyright © Houghton Mifflin Company. All rights reserved. 14a–6 Auto mufflers use destructive interference of sound waves to reduce engine noises. - ( - sign flips phase of the sound wave function) - = 0
 - = 0.")
7
Copyright © Houghton Mifflin Company. All rights reserved. 14a–7 Bose is $200. Want to do it yourself? See Web site. http://www.headwize.com/projects/noise_prj.htm

8
Copyright © Houghton Mifflin Company. All rights reserved. 14a–8

11
Copyright © Houghton Mifflin Company. All rights reserved. 14a–11 Amplitudes of wave functions added An analogy between light waves and atomic wave functions. Amplitudes of wave functions subtracted. NOTE: +/- signs show PHASES of waves, NOT CHARGES!

12
Copyright © Houghton Mifflin Company. All rights reserved. 14a–12 Figure 14.26: (a) The MO energy-level diagram for the H2 molecule (b) The shapes of the Mos are obtained by squaring the wave functions for MO1 and MO2.
 The MO energy-level diagram for the H2 molecule (b) The shapes of the Mos are obtained by squaring the wave functions for MO1 and MO2..")
13
Copyright © Houghton Mifflin Company. All rights reserved. 14a–13 Figure 14.27: Bonding and anitbonding MOs

14
Copyright © Houghton Mifflin Company. All rights reserved. 14a–14 Figure 14.28: MO energy-level diagram for the H 2 molecule # BONDING e’s = 2 # ANTIBONDING e’s = 0 Bond order = ½(2-0) = 1
 = 1.")
15
Copyright © Houghton Mifflin Company. All rights reserved. 14a–15 Figure 14.29: The MO energy-level diagram for the He 2 molecule # BONDING e’s = 2 # ANTIBONDING e’s = 2 Bond order = ½(2-2) = 0
 = 0.")
16
Copyright © Houghton Mifflin Company. All rights reserved. 14a–16 Figure 14.29: The MO energy-level diagram for the He 2 molecule

17
Copyright © Houghton Mifflin Company. All rights reserved. 14a–17 Figure 14.30: The MO energy-level diagram for the He 2 + ion. # BONDING e’s = 2 # ANTIBONDING e’s = 1 Bond order = ½(2-1) = ½
 = ½.")
18
Copyright © Houghton Mifflin Company. All rights reserved. 14a–18 Figure 14.31: The MO energy-level diagram for the H 2 + ion

19
Copyright © Houghton Mifflin Company. All rights reserved. 14a–19 Figure 14.32: The MO energy-level diagram for the H 2 - ion

20
Copyright © Houghton Mifflin Company. All rights reserved. 14a–20

21
Copyright © Houghton Mifflin Company. All rights reserved. 14a–21 Figure 14.33: The relative sizes of the lithium 1s and 2s atomic orbitals

22
Copyright © Houghton Mifflin Company. All rights reserved. 14a–22 Figure 14.34: The MO energy-level diagram for the Li 2 molecule

23
Copyright © Houghton Mifflin Company. All rights reserved. 14a–23 Figure 14.35: The three mutually perpendicular 2p orbitals on two adjacent boron atoms.

24
Copyright © Houghton Mifflin Company. All rights reserved. 14a–24 Figure 14.37: The expected MO energy-level diagram for the combustion of the 2 P orbitals on two boron atoms.

25
Copyright © Houghton Mifflin Company. All rights reserved. 14a–25 Figure 14.36: The two p oribitals on the boron atom that overlap head-on combine to form bonding and antibonding orbitals.

26
Copyright © Houghton Mifflin Company. All rights reserved. 14a–26 Figure 14.36: The two p oribitals on the boron atom that overlap head-on combine to form bonding and antibonding orbitals.

27
Copyright © Houghton Mifflin Company. All rights reserved. 14a–27 Figure 14.37: The expected MO energy-level diagram for the combustion of the 2 P orbitals on two boron atoms.

28
Copyright © Houghton Mifflin Company. All rights reserved. 14a–28 Figure 14.37: The expected MO energy-level diagram for the combustion of the 2 P orbitals on two boron atoms.

29
Copyright © Houghton Mifflin Company. All rights reserved. 14a–29 Figure 14.37: The expected MO energy-level diagram for the combustion of the 2 P orbitals on two boron atoms.

30
Copyright © Houghton Mifflin Company. All rights reserved. 14a–30 Figure 14.38: The expected MO energy-level diagram for the B 2 molecule

31
Copyright © Houghton Mifflin Company. All rights reserved. 14a–31 Figure 14.40: The correct MO energy-level diagram for the B 2 molecule.

32
Copyright © Houghton Mifflin Company. All rights reserved. 14a–32 Figure 14.39: An apparatus used to measure the paramagnetism of a sample

33
Copyright © Houghton Mifflin Company. All rights reserved. 14a–33 Figure 14.41: The MO energy-level diagrams, bond orders, bond energies, and bond lengths for the diatomic molecules, B 2 through F 2.

34
Copyright © Houghton Mifflin Company. All rights reserved. 14a–34 Figure 14.42: When liquid oxygen is poured into the space between the poles of a strong magnet, it remains there until it boils away. Source: Donald Clegg

35
Copyright © Houghton Mifflin Company. All rights reserved. 14a–35 Figure 14.43: The MO energy-level diagram for the NO molecule

36
Copyright © Houghton Mifflin Company. All rights reserved. 14a–36 Figure 14.44: The MO energy-level diagram for both the NO+ and CN- ions

37
Copyright © Houghton Mifflin Company. All rights reserved. 14a–37 Figure 14.45: A partial MO energy-level diagram for the HF molecule

38
Copyright © Houghton Mifflin Company. All rights reserved. 14a–38 Figure 14.46: The electron probability distribution in the bonding MO of the HF molecule

39
Copyright © Houghton Mifflin Company. All rights reserved. 14a–39 Spectroscopy

40
Copyright © Houghton Mifflin Company. All rights reserved. 14a–40 Electromagnetic spectrum

41
(wavelength) x (frequency) = speed [m/s] λν = c [10 8 m/s] E = h ν Energy Per photon:
![(wavelength) x (frequency) = speed [m/s] λν = c [10 8 m/s] E = h ν Energy Per photon:](http://images.slideplayer.com/10/2810802/slides/slide_41.jpg "(wavelength) x (frequency) = speed [m/s] λν = c [10 8 m/s] E = h ν Energy Per photon:")
42
Copyright © Houghton Mifflin Company. All rights reserved. 14a–42

43
Copyright © Houghton Mifflin Company. All rights reserved. 14a–43 Electromagnetic spectrum λ ν

44
Copyright © Houghton Mifflin Company. All rights reserved. 14a–44 WHAT MAKES A MOLECULE ABSORB LIGHT? When should you push? AT THE RESONANT FREQUENCY

45
Copyright © Houghton Mifflin Company. All rights reserved. 14a–45 λν=c AT THE RESONANT FREQUENCY

46
Copyright © Houghton Mifflin Company. All rights reserved. 14a–46 Figure 14.55: The molecular orbital diagram for the ground state of NO +

47
Copyright © Houghton Mifflin Company. All rights reserved. 14a–47 λν=c AT THE RESONANT FREQUENCY VIBRATING DIPOLES!

48
Copyright © Houghton Mifflin Company. All rights reserved. 14a–48

49
What makes a molecule absorb light? [cm -1 ] = 1/λ = ν/c =E/hc
![What makes a molecule absorb light [cm -1 ] = 1/λ = ν/c =E/hc](http://images.slideplayer.com/10/2810802/slides/slide_49.jpg "What makes a molecule absorb light [cm -1 ] = 1/λ = ν/c =E/hc")
50
Copyright © Houghton Mifflin Company. All rights reserved. 14a–50 Figure 14.60: The three fundamental vibrations for sulfur dioxide

51
Copyright © Houghton Mifflin Company. All rights reserved. 14a–51

52
What makes a molecule absorb light? 3200 cm −1 broad, strong O-H stretch (alcohols) 3000 cm −1 broad, medium O-H stretch (carboxylic acids) 1200 cm −1 strong, O-H bending 2800 cm −1 strong, C-H stretch 1400 cm −1 variable, C-H bending 1700 cm −1 strong, C=O stretch 1200 cm −1 strong, C-O stretch
 3000 cm −1 broad, medium O-H stretch (carboxylic acids) 1200 cm −1 strong, O-H bending 2800 cm −1 strong, C-H stretch 1400 cm −1 variable, C-H bending 1700 cm −1 strong, C=O stretch 1200 cm −1 strong, C-O stretch.")
53
What makes a molecule absorb light?

54
Copyright © Houghton Mifflin Company. All rights reserved. 14a–54 Figure 14.61: The infrared spectrum of CH 2 Cl 2.

55
What makes a molecule absorb light?

56
Copyright © Houghton Mifflin Company. All rights reserved. 14a–56 Figure 14.52: Schematic representation of two electronic energy levels in a molecule

57
Copyright © Houghton Mifflin Company. All rights reserved. 14a–57 Figure 14.53: The various types of transitions are shown by vertical arrows.

58
Copyright © Houghton Mifflin Company. All rights reserved. 14a–58 Figure 14.54: Spectrum corresponding to the changes indicated in Fig. 14.53.

59
Copyright © Houghton Mifflin Company. All rights reserved. 14a–59 The molecular structure of beta-carotene

60
Copyright © Houghton Mifflin Company. All rights reserved. 14a–60 Figure 14.57: The electronic absorption spectrum of beta-carotene.

61
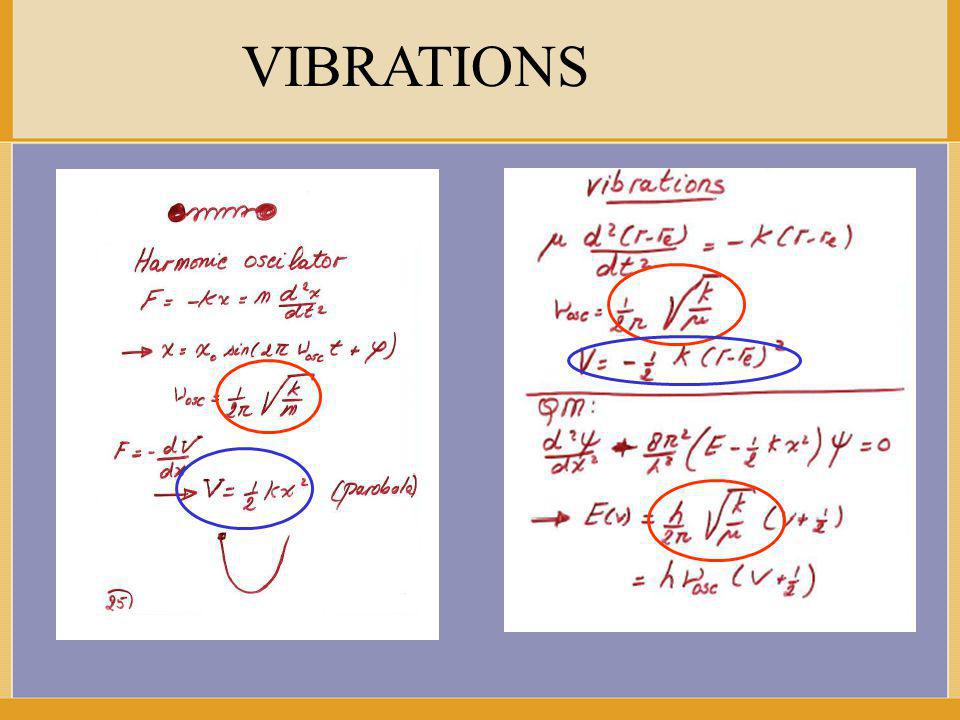
VIBRATIONS

63
Copyright © Houghton Mifflin Company. All rights reserved. 14a–63 Figure 14.58: The potential curve for a diatomic molecule

64
Copyright © Houghton Mifflin Company. All rights reserved. 14a–64 Figure 14.59: Morse energy curve for a diatomic molecule.

65
Copyright © Houghton Mifflin Company. All rights reserved. 14a–65 Figure 14.62: Representations of the two spin states of the proton interacting

66
Copyright © Houghton Mifflin Company. All rights reserved. 14a–66 Figure 14.63: The molecular structure of bromoethane

67
Copyright © Houghton Mifflin Company. All rights reserved. 14a–67 Figure 14.64: The expected NMR spectrum for bromoethane

68
Copyright © Houghton Mifflin Company. All rights reserved. 14a–68 Figure 14.65: The spin of proton H y can by "up" or "down"

69
Copyright © Houghton Mifflin Company. All rights reserved. 14a–69 Figure 14.66: The spins for protons H y can be "up", can be opposed (in 2 ways) or can both be "down"
 or can both be down .")
70
Copyright © Houghton Mifflin Company. All rights reserved. 14a–70 Figure 14.67: The spins for the protons H y can by arranged as shown in (a) leading to four different magnetic environments
 leading to four different magnetic environments.")
71
Copyright © Houghton Mifflin Company. All rights reserved. 14a–71 Figure 14.68: The NMR spectrum of CH 3 CH 2 B r (bromoethane) with TMS reference
 with TMS reference.")
72
Copyright © Houghton Mifflin Company. All rights reserved. 14a–72 Figure 14.69: The molecule (2-butanone)
.")
73
Copyright © Houghton Mifflin Company. All rights reserved. 14a–73 Figure 14.70: A technician speaks to a patient before heis moved intot eh cavity of a magnetic resonance imaging (MRI) machine.
 machine..")
74
Copyright © Houghton Mifflin Company. All rights reserved. 14a–74 Figure 14.71: A colored Magnetic Resonance Imaging (MRI) scan through a human head, showing a healthy brain in side view.
 scan through a human head, showing a healthy brain in side view..")
Similar presentations


 Covalent Bonding: Orbitals (contd). Figure 9.26: (a) The molecular orbital energy- level diagram for the H 2 molecule. (b) The shapes of.>")
>")


