Download presentation
Presentation is loading. Please wait.

1
Maps & Graphs!!

2
What is a graph? A diagram that exhibits a relationship, often functional, between two sets of numbers as a set of points having coordinates determined by the relationship. OR / AND A pictorial device, such as a pie chart or bar graph, used to illustrate quantitative relationships. Also called chart. OR A diagram showing how two qualities are related

3
Examples of Graphs

4
What kind of graph is this?

5
What kind of graph is this?

6
What kind of graph is this?

7
Data terminology Mean Mode Range Median

8
Data terminology Mean (Average) Mode
approximating the statistical norm or average or expected value Mode is the value that occurs the most frequently in a data set

9
Data terminology Range Median
The range of data in the set. i.e. the highest and lowest values in the data set Median the middle value of an ordered set of values

10
Interpreting Graphs

11
Interpreting Graphs

12
What is a map? A map is a simplified version of reality and is used to record information about the earth’s surface. Maps show a ‘bird’s eye’ view of an area and is drawn to scale AND Maps are a way of communicating information about places

13
What are the 5 essential elements of ALL maps??

14
What are the 5 essential elements of ALL maps??
Title Grid Direction Scale Legend You may know these from BOLTTS

15
What kind of map is this?

16
What kind of map is this?

17
What kind of map is this?

18
What kind of map is this?

19
What is this kind of map?

20
What is this kind of map?

21
What is a choropleth map?
A map used to show the average density (or concentration) of features such as population and rainfall
 of features such as population and rainfall.")
22
What is a choropleth map?
Each area that falls within a particular range is allocated an appropriate colour until the overall pattern is revealed.

23
What is a proportional circle map?
A map that uses symbols (shapes – generally circles) drawn in a proportional size of a represented variable.
 drawn in a proportional size of a represented variable.")
24
What is a flowline map? Flowline maps are designed to show movement – most commonly transports systems or flow of people with the use of arrows with the width of the arrow representing the amount.

25
Photographs Ground photos are those taken at ground level with the camera pointed horizontally. Aerial photos are taken from the air or a high point. They can be: Oblique – an aerial photo taken on an angle Vertical – photo taken from a plane with the camera lens pointing straight down

26
Photographs Satellite images – are taken from space that are digitally captured data of the earth’s surface which is processed to produced a digital image.

27
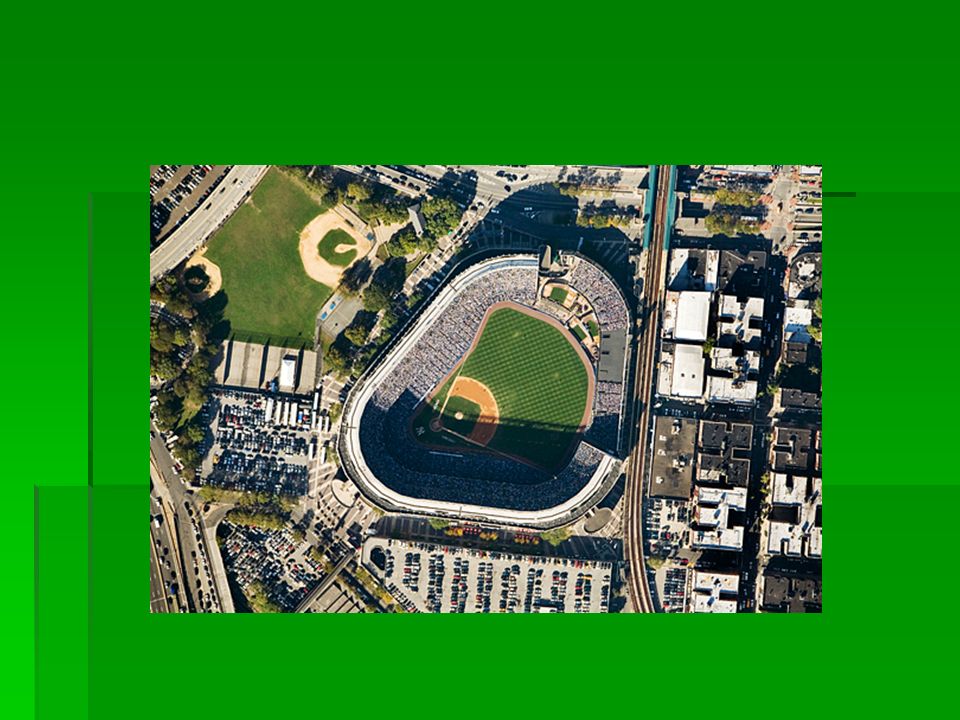
What type of photos are these?

31
Photo-Sketch

32
What is a topographic map?
Topography (topo-, "place", and graphia, "writing") is the study of Earth's surface features
 is the study of Earth s surface features.")
33
What is a topographic map?
Its a map which accurately depicts the physical features and relief (landscape) of an area by using contour lines to represent the size, shape, and elevation of the features. They are usually maps of fairly small areas such as a town, or city and its surrounding countryside
 of an area by using contour lines to represent the size, shape, and elevation of the features. They are usually maps of fairly small areas such as a town, or city and its surrounding countryside.")
34
Topographic maps show…
Natural Features: rivers, vegetation, coasts and relief (hills, plains, plateaus, mountains etc) Cultural Features: roads, railways, bridges, houses
 Cultural Features: roads, railways, bridges, houses.")
35
Examples of Natural & Cultural features
Mine

36
Examples of Natural & Cultural features
Forest

37
Examples of Natural & Cultural features
Dairy Farm

38
Examples of Natural & Cultural features
Town

39
Examples of Natural & Cultural features
River

40
Elements of Topographic Maps
Contours Scale Grids Direction & Bearing Measuring Distance & Area

41
Group work Your must ensure that every member of your group understands all aspects of your section Any one of your group will be called upon to present information or answer questions You must be able to co-operate, listen and most importantly contribute All group members must have some part / role

Similar presentations


 1. How do contour lines show elevation, slope, and relief? 2. Why do contour lines never cross on a topographic map? 4. For an area.>")


