Download presentation
Presentation is loading. Please wait.

1
Review of Catalogs and Rate Determination in UCERF2 and Plans for UCERF3 Andy Michael

3
Historical Earthquake Catalog: 1850 – 1932 Primary compilation: Toppozada and Branum (2003) 1769-1999, M≥5.5, magnitude based on area with MMI V, VI, VIII, relies on many other sources for magnitude of individual events. 417 events from 1850-1931 Location and magnitude solved independently. Bakun (1999, 2000, 2006) independently analyzed 84 events location and magnitude jointly based on fitting intensity at points to a ground motion prediction relationship. Magnitudes generally agree well. In the Bay Area: 15 are given the same magnitudes 17 differ by 0.1 11 differ by 0.2 3 differ by more (0.4, 0.5, and 0.6) – sparse data
 independently analyzed 84 events location and magnitude jointly based on fitting intensity at points to a ground motion prediction relationship. Magnitudes generally agree well. In the Bay Area: 15 are given the same magnitudes 17 differ by differ by differ by more (0.4, 0.5, and 0.6) – sparse data.")
4
Instrumental Catalog: 1932 – 2006 CGS compilation of the Southern and Northern California Catalogs and for Nevada also use NEIC and Nevada Seismological Lab. Mostly ML for M≥4, some Md in northern California Mw for larger recent events taken from Global CMT catalog From 1972 on used ANSS merged catalog Some problems with updated SCSN catalog not in ANSS and so the updated SCSN version of events was used. This appears to have been fixed.

5
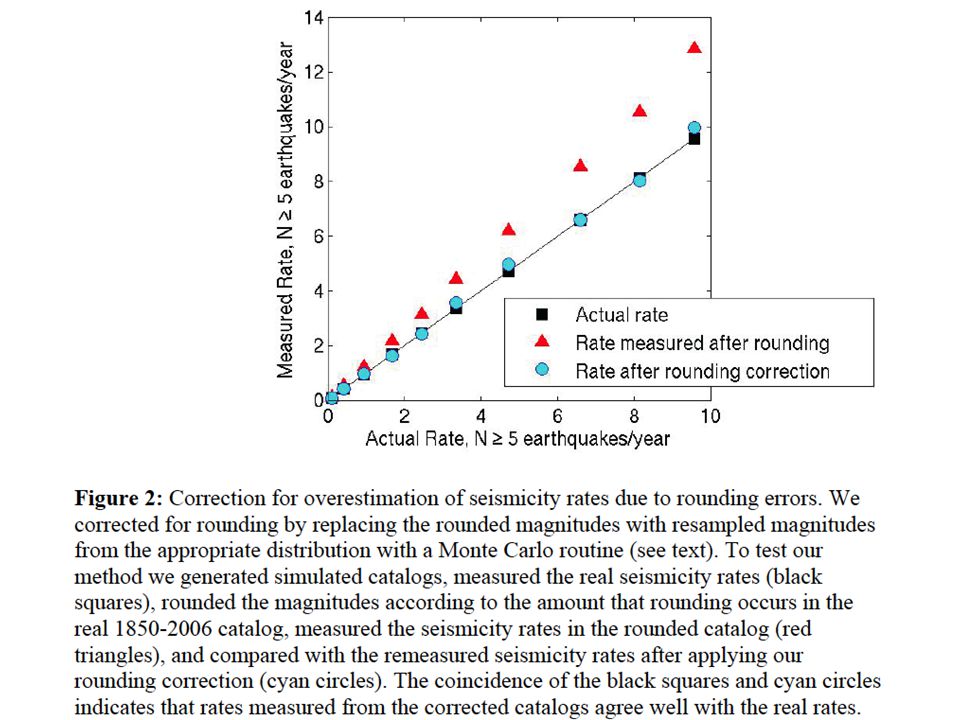
Magnitude Error and Rounding Toppozada and Branum: ±0.3 units when data is sparse Bakun: individually estimated errors, similar when data is sparse. Bakun’s uncertainties could be underestimates because the magnitude uncertainty does not take into account location uncertainty. When magnitudes agree and Bakun’s errors are smaller then used Toppozada’s magnitude and Bakun’s uncertainty. When error is unknown ±0.333 is used but true errors could be higher. If errors are higher than estimated then rates could be overestimated.

6
Magnitude Error and Rounding SCSN: new uncertainties caluclated using a bootstrap of the amplitudes used to calculate the magnitudes. NCSN: uncertainties for most events listed in catalogs. Global CMT: 0.09 uncertainty from Kagan et al. (2006) which is consistent with 0.08 estimated by Bakun (1999).
 which is consistent with 0.08 estimated by Bakun (1999)..")
7
Rounding: Historic events: 0.1 SCSN: 0.01. NCSN: uncertainties for most events listed in catalogs. Global CMT: calculated to 0.01 from moment. 1910-1932: 0.1 or 0.5 depending on event (estimated from histograms of magnitudes)
.")
11
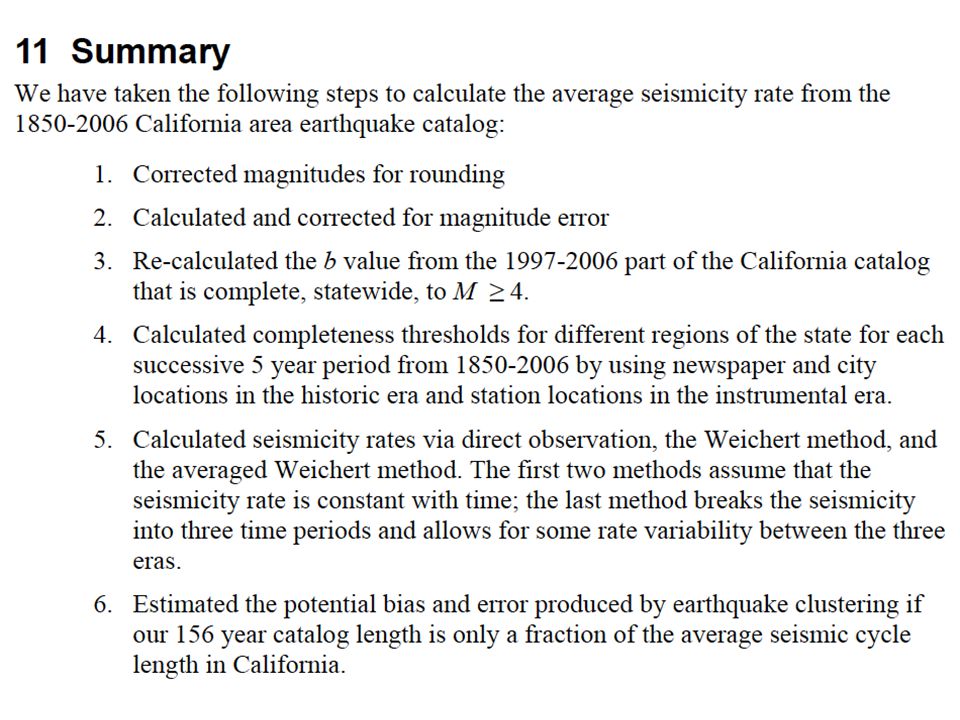
logN=a−bM The a and b values found here are calculated using methods employed by the 1996 and 2002 National Hazard Maps, with several revisions. These revisions include: making corrections for magnitude error and rounding before calculating a values, using only modern instrumental data to calculate b value, and using a new comprehensive and spatially variable assessment of the magnitude completeness threshold as a function of time.

12
We also calculate the seismicity rate in several different ways to account for the fact that the seismicity rate may change with time (for example, the higher seismicity rates in the San Francisco Bay Area before 1927 than after), and perform simulations to evaluate the accuracy with which the seismicity rate averaged over the last 156 years represents the true long term seismicity rate.
, and perform simulations to evaluate the accuracy with which the seismicity rate averaged over the last 156 years represents the true long term seismicity rate.")
13
Finally, the National Hazard Maps have traditionally only used the historical earthquake solutions of Toppozada, most recently compiled in Toppozada et al. (2002). We do our calculations both with the Toppozada solutions and with 84 of the Toppozada solutions substituted with historical earthquake solutions of Bakun (Bakun 1999; Bakun 2000; Bakun 2006). We find that this substitution creates an insignificant increase in the statewide seismicity rate of 0.6%, although it may produce larger differences on a regional level.
. We do our calculations both with the Toppozada solutions and with 84 of the Toppozada solutions substituted with historical earthquake solutions of Bakun (Bakun 1999; Bakun 2000; Bakun 2006). We find that this substitution creates an insignificant increase in the statewide seismicity rate of 0.6%, although it may produce larger differences on a regional level..")
16
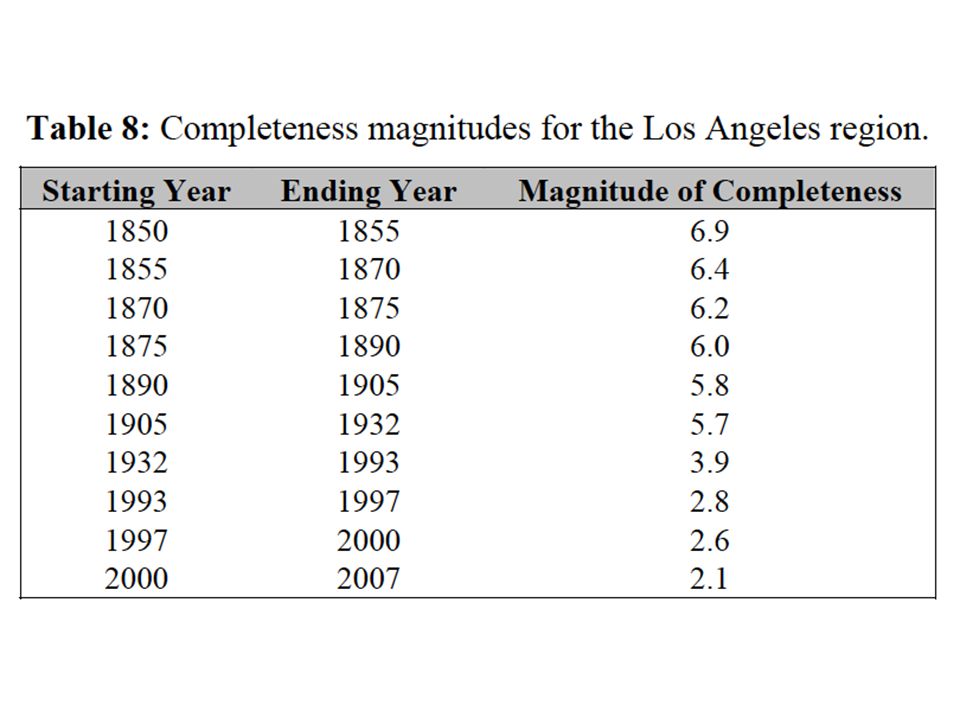
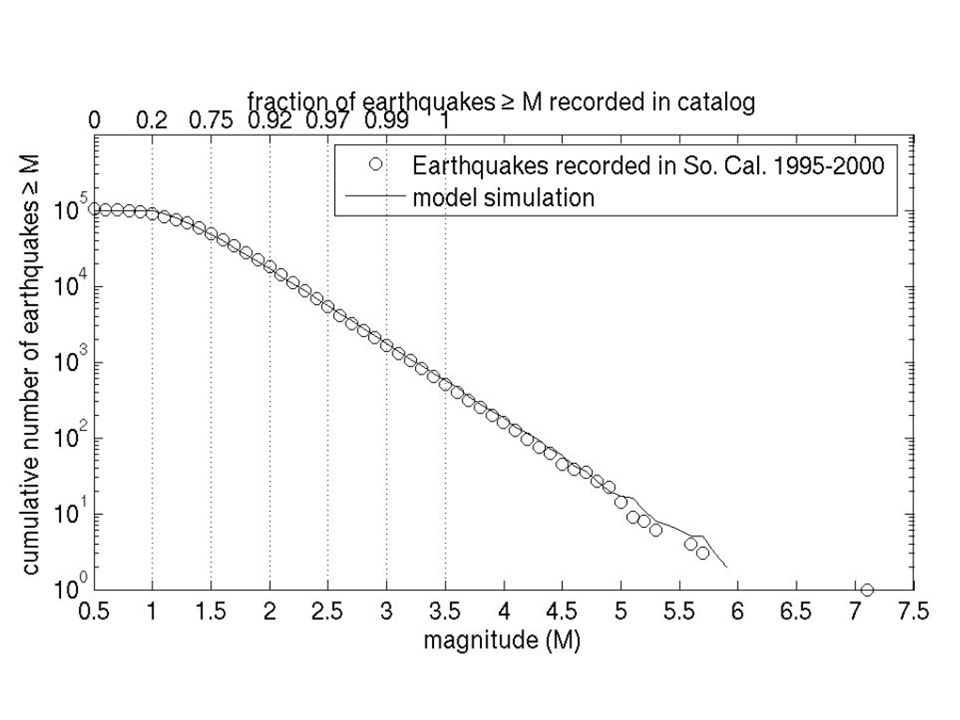
Completeness Schorlemmer et al. (2006) bases completeness thresholds in Southern California on observations of how frequently individual seismic stations detect earthquakes of different magnitudes and distances. For each location determine completeness by proximity to stations that record earthquakes with some quality. Extended to historical sources.
 bases completeness thresholds in Southern California on observations of how frequently individual seismic stations detect earthquakes of different magnitudes and distances. For each location determine completeness by proximity to stations that record earthquakes with some quality. Extended to historical sources..")
24
Plans for UCERF3: Further consider uncertainties and biases in intensity assignments and magnitudes of historic earthquakes. Could these change the seismicity rate in the historic catalog? Could this change the empirical model? Could this improve the fit between observed and modeled rates? What can be done without redoing the entire historic catalog? Declustering: Traditionally use Gardner and Knopoff (1974) Produces change in b-value from 1 to 0.8 ETAS models use the same magnitude frequency distribution for mainshocks and aftershocks. Consider other declustering methods How will this affect rates? How do we do this while being consistent with national maps?
 Produces change in b-value from 1 to 0.8 ETAS models use the same magnitude frequency distribution for mainshocks and aftershocks. Consider other declustering methods How will this affect rates. How do we do this while being consistent with national maps .")
25
More Plans for UCERF3: Changes in instrumental magnitudes. Characterize off-fault seismicity focal mechanisms and Mmax New assignments of historic events to faults (?) New approaches to smoothed seismicity rates Magnitude-Frequency Distributions: Characteristic versus Gutenberg-Richter
 New approaches to smoothed seismicity rates Magnitude-Frequency Distributions: Characteristic versus Gutenberg-Richter.")
Similar presentations


?>")
 BSHAP Earthquake Catalogue.>")


