Download presentation
Presentation is loading. Please wait.

1
Review Ch. 4 and Ch. 12

2
Chapter 4 Outline 1.What is financial planning 2.Financial planning models 3.The percentage of sales approach 4.External financing and growth 5.Caveats in financial planning 2

3
Percentage of sales approach: COMPUTERFIELD CORPORATION Financial Statements Income statementBalance sheet Sales$8,000C AC A $5000Debt$8250 Costs5,800FA $7000Equity$3750 Net Income$2,200Total$12000Total$12000 3

4
EFN and Capacity Usage Suppose COMPUTERFIELD is operating at 80% capacity: 1. What would be sales at full capacity? (1p) 2. What is the capital intensity ratio at full capacity? (1p) 3. What is EFN at full capacity and Dividend payout ratio is 15%? (1p) What is EFN to increase sales to 12000 and Dividend payout ratio is 35%? 4
 2. What is the capital intensity ratio at full capacity. (1p) 3. What is EFN at full capacity and Dividend payout ratio is 15%. (1p) What is EFN to increase sales to and Dividend payout ratio is 35%. 4.")
5
Q 1:8,000/.8=10,000; Full capacity as increase 10,000/8,000 = 1.25 (25%) Income statement Sales $8,000 Costs $5,800 N I $2,200 Ret earnings 2,200*.85=1,870 New Ret earnings 1,870*1.25=2,337.5 There is no indication that any changes took place in % cost for the proforma income statement, we can get the same result by increasing RE or by creating proforma IS 13-5
 Income statement Sales $8,000 Costs $5,800 N I $2,200 Ret earnings 2,200*.85=1,870 New Ret earnings 1,870*1.25=2,337.5 There is no indication that any changes took place in % cost for the proforma income statement, we can get the same result by increasing RE or by creating proforma IS 13-5")
6
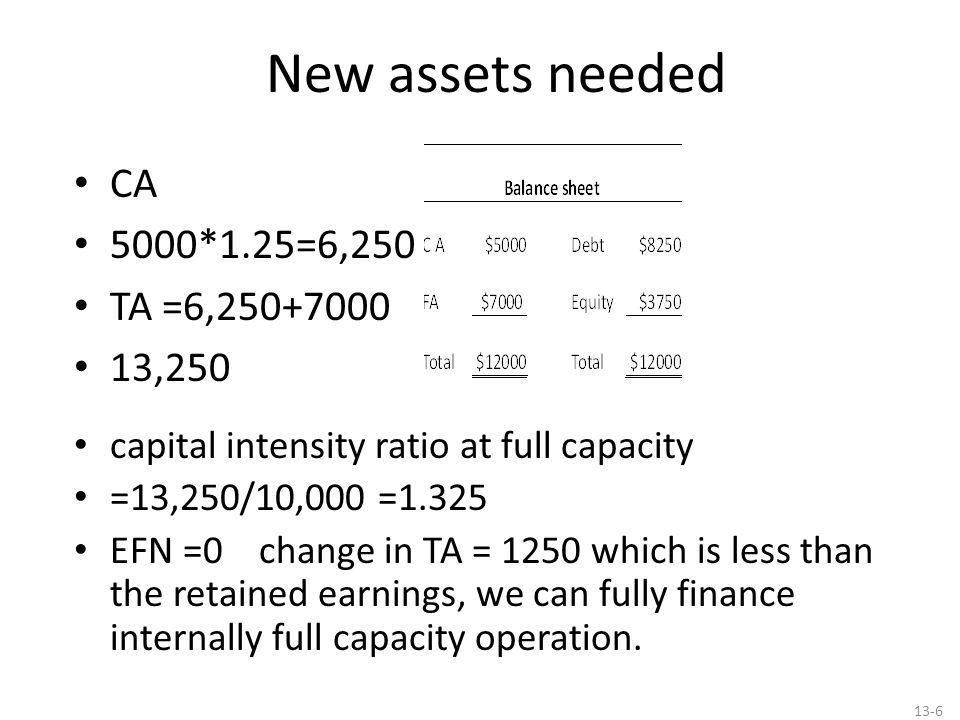
New assets needed CA 5000*1.25=6,250 TA =6,250+7000 13,250 capital intensity ratio at full capacity =13,250/10,000 =1.325 EFN =0 change in TA = 1250 which is less than the retained earnings, we can fully finance internally full capacity operation. 13-6
7
What is EFN to increase sales to 12,000 (50%) and Dividend payout ratio is 35%? Income statement Sales $8,000 Costs $5,800 N I $2,200 Ret earnings 2,200*.65=1,430 New Ret earnings 1,430*1.5=2,145 There is no indication that any changes took place in % cost for the proforma income statement, we can get the same result by increasing RE or by creating proforma IS 13-7

8
Recent Sales 8,000; Proj. Sales 12,000 Increase 50% CA 5,000*1. 5=7,500 FA=7,000+1,400 TA =15,900 FA=7000/10000 per unit of sales=.7 Inv. Need for 2000 more units of sales =.7*2000=1,400 EFN=1,755 change in TA = 3,900 from RE=2,145 13-8

9
EFN=1,755 D/E ratio =3/2 EFN=1,755 How much debt should be issued? How much equity? If they issue only debt (all 1,755 in bonds) what will be the D/E ratio on the proforma BS? D=8,250+1,755=10,005 E=3,750+2,145=5,895 D/E=1.69 13-9
 what will be the D/E ratio on the proforma BS. D=8,250+1,755=10,005 E=3,750+2,145=5,895 D/E=")
10
Please, Review also Internal Growth Rate Sustainable Growth Rate

11
Chapter 12 Overview Return of an investment: arithmetic and geometric The variability of returns Efficiency of capital markets 11

12
Arithmetic vs. Geometric Averages (1) Geometric return = the average compound return earned per year over multiyear period Arithmetic average return = the return earned in an average (typical) year over a multiyear period 12 Geometric average return =
 Geometric return = the average compound return earned per year over multiyear period Arithmetic average return = the return earned in an average (typical) year over a multiyear period 12 Geometric average return =.")
13
The Variability of Returns Variance = the average squared deviation between the actual return and the average return Standard deviation = the positive square root of the variance 13

14
The Normal Distribution (2) 14
 14")
15
Z-score For any normal random variable: Z – z-score X – normal random variable - mean 15

Similar presentations


>")


 Additional paid-in capital Accumulated other comprehensive.>")

