Download presentation
Presentation is loading. Please wait.

1
Analysis of Financial Statements
Chapter 17 1 1 1 1 1

2
Application of analytical tools Involves transforming data
Basics of Analysis Application of analytical tools Reduces uncertainty Involves transforming data

3
Financial statement analysis helps users make better decisions.
Purpose of Analysis Financial statement analysis helps users make better decisions. Internal Users External Users Managers Officers Internal Auditors Shareholders Lenders Customers

4
Building Blocks of Analysis
Ability to meet short-term obligations and to efficiently generate revenues Ability to generate future revenues and meet long-term obligations Liquidity and Efficiency Solvency Ability to provide financial rewards sufficient to attract and retain financing Ability to generate positive market expectations Market Prospects Profitability

5
Information for Analysis
Income Statement Notes Balance Sheet Statement of Changes in Stockholders’ Equity Statement of Cash Flows

6
Standards for Comparison
To help me interpret our financial statements, I use several standards of comparison. Intracompany Competitor Industry Guidelines

7
Comparing a company’s financial condition and performance across time
Tools of Analysis Horizontal Analysis Comparing a company’s financial condition and performance across time Time

8
Tools of Analysis V e r t i c a l
Comparing a company’s financial condition and performance to a base amount

9
Using key relations among financial statement items
Tools of Analysis Using key relations among financial statement items Ratio Analysis

10
Now, let’s look at some ways to use horizontal analysis.
Time

12
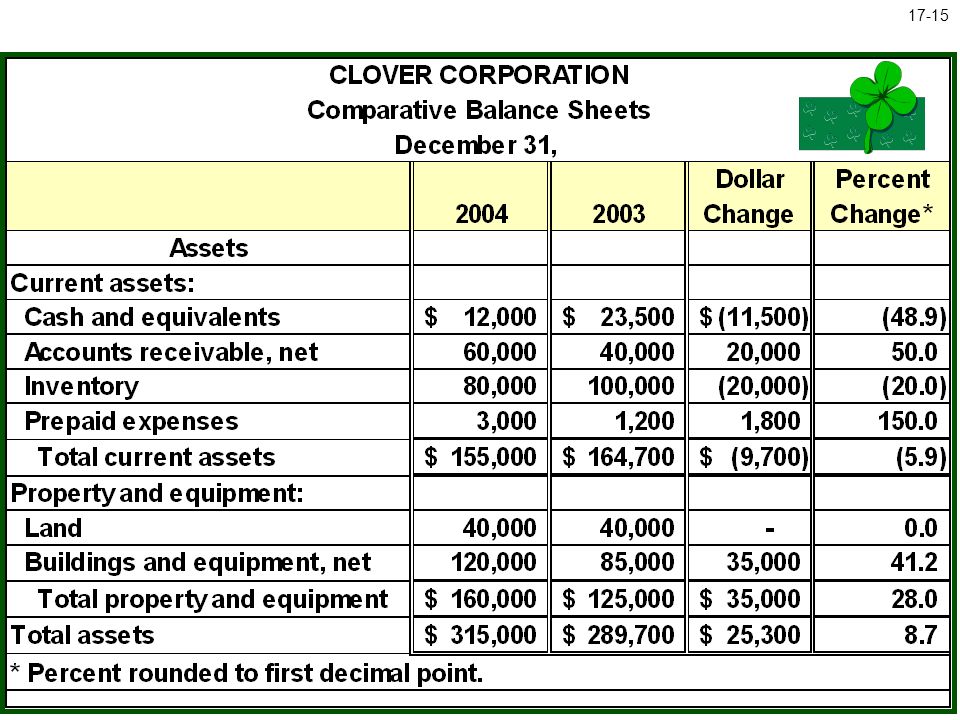
Comparative Statements
Calculate Change in Dollar Amount Dollar Change Analysis Period Amount Base Period Amount = – Since we are measuring the amount of the change between 2003 and 2004, the dollar amounts for 2003 become the “base” period amounts.

13
Comparative Statements
Calculate Change as a Percent Percent Change Dollar Change Base Period Amount × = 100%

14
$12,000 – $23,500 = $(11,500) ($11,500 ÷ $23,500) × 100% = 48.9%
 ($11,500 ÷ $23,500) × 100% = 48.9%")
16
Now, let’s review the dollar and percent changes for the liabilities and shareholders’ equity accounts.

18
Now, let’s look at trend analysis!

19
Analysis Period Amount
Trend Analysis Trend analysis is used to reveal patterns in data covering successive periods. Trend Percent Analysis Period Amount Base Period Amount 100% = ×

20
Trend Analysis 2000 is the base period so its amounts will equal 100%.
Berry Products Income Information For the Years Ended December 31, 2000 is the base period so its amounts will equal 100%.

21
For the Years Ended December 31,
Trend Analysis Berry Products Income Information For the Years Ended December 31,

22
Trend Analysis How would this trend analysis look on a line graph?
Berry Products Income Information For the Years Ended December 31, How would this trend analysis look on a line graph?

23
Trend Analysis We can use the trend percentages to construct a graph so we can see the trend over time.

24
Now, let’s look at some vertical analysis tools!

25
Common-Size Statements
Calculate Common-size Percent Common-size Percent Analysis Amount Base Amount × = 100% Financial Statement Base Amount Balance Sheet Total Assets Income Statement Revenues

26
($12,000 ÷ $315,000) × 100% = 3.8% ($23,500 ÷ $289,700) × 100% = 8.1%
 × 100% = 3.8% ($23,500 ÷ $289,700) × 100% = 8.1%")
30
Common-Size Graphics This is a graphical analysis of Clover Corporation’s common-size income statement for 2004.

31
Liquidity and Efficiency
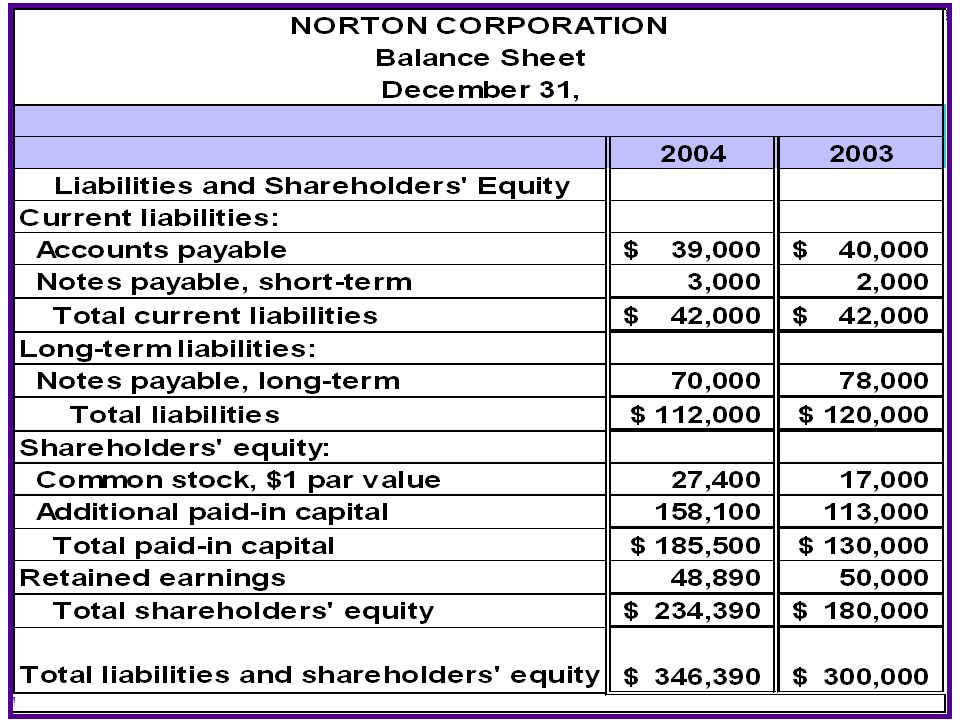
Solvency Ratio Analysis Profitability Market Let’s use the following financial statements for Norton Corporation for our ratio analysis.

35
Liquidity and Efficiency
Current Ratio Inventory Turnover Acid-test Ratio Days’ Sales Uncollected Accounts Receivable Turnover Days’ Sales in Inventory Total Asset Turnover

36
Use this information to calculate the liquidity and efficiency ratios for Norton Corporation.

37
Working Capital Working capital represents current assets financed from long-term capital sources that do not require near-term repayment.

38
This ratio measures the short-term debt-paying ability of the company.
Current Ratio Current Ratio Current Assets Current Liabilities = Current Ratio $65,000 $42,000 = 1.55 : 1 This ratio measures the short-term debt-paying ability of the company.

39
Quick Assets Current Liabilities
Acid-Test Ratio Quick Assets Current Liabilities = Acid-Test Ratio Quick assets are Cash, Short-Term Investments, and Current Receivables. $50,000 $42,000 = 1.19 : 1 Acid-Test Ratio This ratio is like the current ratio but excludes current assets such as inventories and prepaid expenses that may be difficult to quickly convert into cash.

40
Accounts Receivable Turnover
Sales on Account Average Accounts Receivable Accounts Receivable Turnover = = times $494,000 ($17,000 + $20,000) ÷ 2 Accounts Receivable Turnover = This ratio measures how many times a company converts its receivables into cash each year.
 ÷ 2. Accounts Receivable. Turnover. = This ratio measures how many times a company converts its receivables into cash each year.")
41
This ratio measures the number is sold and replaced during the year.
Inventory Turnover Cost of Goods Sold Average Inventory Inventory Turnover = = times $140,000 ($10,000 + $12,000) ÷ 2 = Inventory Turnover This ratio measures the number of times merchandise is sold and replaced during the year.
 ÷ 2. = Inventory. Turnover. This ratio measures the number. of times merchandise. is sold and replaced during the year.")
42
Days’ Sales Uncollected
Accounts Receivable Net Sales = ´ 365 Days’ Sales Uncollected $20,000 $494,000 = ´ = days This ratio measures the liquidity of receivables.

43
Days’ Sales in Inventory
= Ending Inventory Cost of Goods Sold ´ 365 Days’ Sales in Inventory = $12,000 $140,000 ´ = days This ratio measures the liquidity of inventory.

44
This ratio measures the efficiency of assets in producing sales.
Total Asset Turnover Total Asset Turnover = Net Sales Average Total Assets = 1.53 times $494,000 ($300,000 + $346,390) ÷ 2 = Total Asset Turnover This ratio measures the efficiency of assets in producing sales.
 ÷ 2. = Total Asset. Turnover. This ratio measures the efficiency of assets in producing sales.")
45
Pledged Assets to Secured Liabilities
Solvency Debt Ratio Equity Ratio Pledged Assets to Secured Liabilities Times Interest Earned

46
Use this information to calculate the solvency ratios for Norton Corporation.

47
Debt Ratio Total Liabilities = Debt Ratio Total Assets $112,000
$346,390 Debt Ratio = 32.3% This ratio measures what portion of a company’s assets are contributed by creditors.

48
Equity Ratio Total Equity Equity Ratio = Total Assets $234,390
$346,390 Equity Ratio = 67.7% This ratio measures what portion of a company’s assets are contributed by owners.

49
Pledged Assets to Secured Liabilities
Book Value of Pledged Assets = Book Value of Secured Liabilities Pledged Assets to Secured Liabilities This ratio measures the protection to secured creditors.

50
Net Income before Interest Expense
Times Interest Earned Times Interest Earned Net Income before Interest Expense and Income Taxes Interest Expense = Times Interest Earned $84,000 $7,300 = = This is the most common measure of the ability of a firm’s operations to provide protection to the long-term creditor.

51
Profitability Profit Margin Basic Earnings per Share Gross Margin
Book Value per Common Share Return on Total Assets Return on Common Stockholders’ Equity

52
Use this information to calculate the profitability ratios for Norton Corporation.

53
Profit Margin Profit Margin Net Income Net Sales = = 10.87% Profit
$53,690 $494,000 = This ratio describes a company’s ability to earn a net income from sales.

54
Net Sales - Cost of Sales
Gross Margin Gross Margin Net Sales - Cost of Sales Net Sales = = 71.66% Gross Margin $494,000 - $140,000 $494,000 = This ratio measures the amount remaining from $1 in sales that is left to cover operating expenses and a profit after considering cost of sales.

55
Return on Total Assets Return on Total Assets Net Income
Average Total Assets = = 16.61% $53,690 ($300,000 + $346,390) ÷ 2 = Return on Total Assets This ratio is generally considered the best overall measure of a company’s profitability.
 ÷ 2. = Return on Total Assets. This ratio is generally considered. the best overall measure of a. company’s profitability.")
56
Return on Common Stockholders’ Equity
Net Income - Preferred Dividends Average Common Stockholders’ Equity = = 25.9% $53, ($180,000 + $234,390) ÷ 2 = Return on Common Stockholders’ Equity This measure indicates how well the company employed the owners’ investments to earn income.
 ÷ 2. = Return on Common Stockholders’ Equity. This measure indicates how well the company employed the owners’ investments to earn income.")
57
Book Value per Common Share
Shareholders’ Equity Applicable to Common Shares Number of Common Shares Outstanding = This ratio measures liquidation at reported amounts.

58
Basic Earnings per Share
Net Income - Preferred Dividends Weighted-Average Common Shares Outstanding = Basic Earnings per Share $53, 27,400 = = $1.96 per share This measure indicates how much income was earned for each share of common stock outstanding.

59
Market Prospects Price-Earnings Ratio Dividend Yield

60
Market Prospects Use this information to calculate the market ratios for Norton Corporation.

61
Price-Earnings Ratio Price-Earnings Ratio Market Price Per Share
Earnings Per Share = Price-Earnings Ratio $15.00 $1.96 = = 7.65 times This measure is often used by investors as a general guideline in gauging stock values. Generally, the higher the price-earnings ratio, the more opportunity a company has for growth.

62
Annual Dividends Per Share
Dividend Yield Dividend Yield Annual Dividends Per Share Market Price Per Share = $2.00 $15.00 = 13.3% This ratio identifies the return, in terms of cash dividends, on the current market price of the stock.

63
End of Chapter 17

Similar presentations


>")


