Download presentation
Presentation is loading. Please wait.

2
Data: Quantitative (Histogram, Stem & Leaf, Boxplots) versus Categorical (Bar or Pie Chart) Boxplots: 5 Number Summary, IQR, Outliers???, Comparisons Center, Shape & Spread! For Skewed Data use…median & IQR For Symmetric data use…mean & SD Normal Model (68 - 95 - 99.7), SD & z- scores
, SD & z- scores.")
3
Linear Regression: Explanatory and response variables. Association versus Correlation Correlation Coefficient - strength and direction Residuals R-squared Influential Points (leverage) & outliers Extrapolation Ladder of Powers
 & outliers Extrapolation Ladder of Powers.")
22
Random Digits & Simulations –Identify component –Explain how model outcome –Explain how simulate trial –State response variable –Run trials –Analyze response variable –State conclusion in context

23
Surveys –Population versus sample –SRS –Randomizing & representative –Sampling Variability –Design: Stratified Cluster Systematic

24
Watch out for bias!!! –Voluntary –Convenience –Under-coverage –Non-response –Response

25
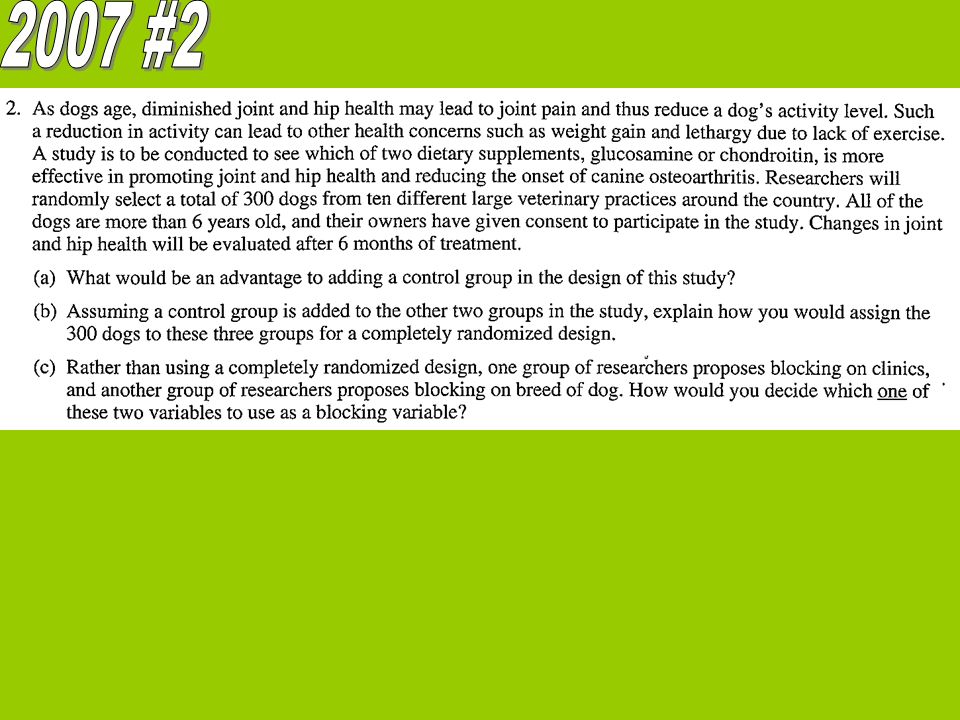
Observational Studies –Retrospective versus prospective Experiments –Random assignment of subjects –Level, factor & treatments –4 principles of experimental design Control extraneous variation Randomize subjects Replicate Block & blind –Statistically significant??? –Control versus placebo –Best experiments are randomized, comparative (control), double-blind & placebo-controlled!!!
, double-blind & placebo-controlled!!!.")
26
–Matched Pairs Match subjects that are similar in ways not under study (ex: right & left feet) –Randomized Block Design –Causation? If only possible explanation for the difference is… –Lurking versus confounding variables

28
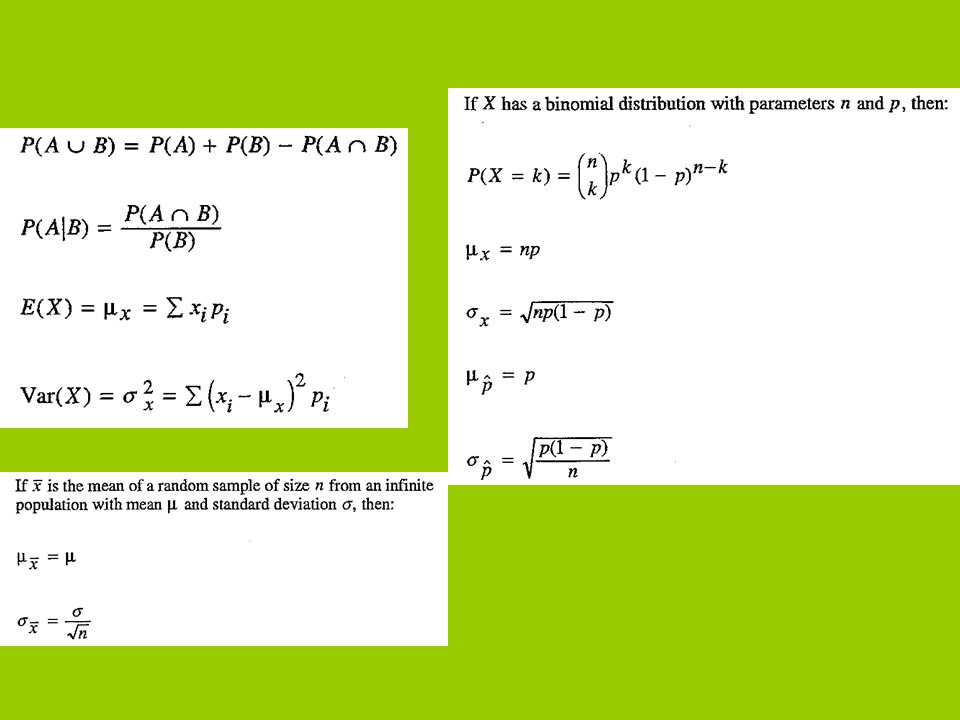
Probability Rules –Complement –Addition Rule (Disjoint) –General Addition Rule –Multiplication Rule (Independent) –Conditional Probabilities & Independence –Tree Diagrams
 –General Addition Rule –Multiplication Rule (Independent) –Conditional Probabilities & Independence –Tree Diagrams")
29
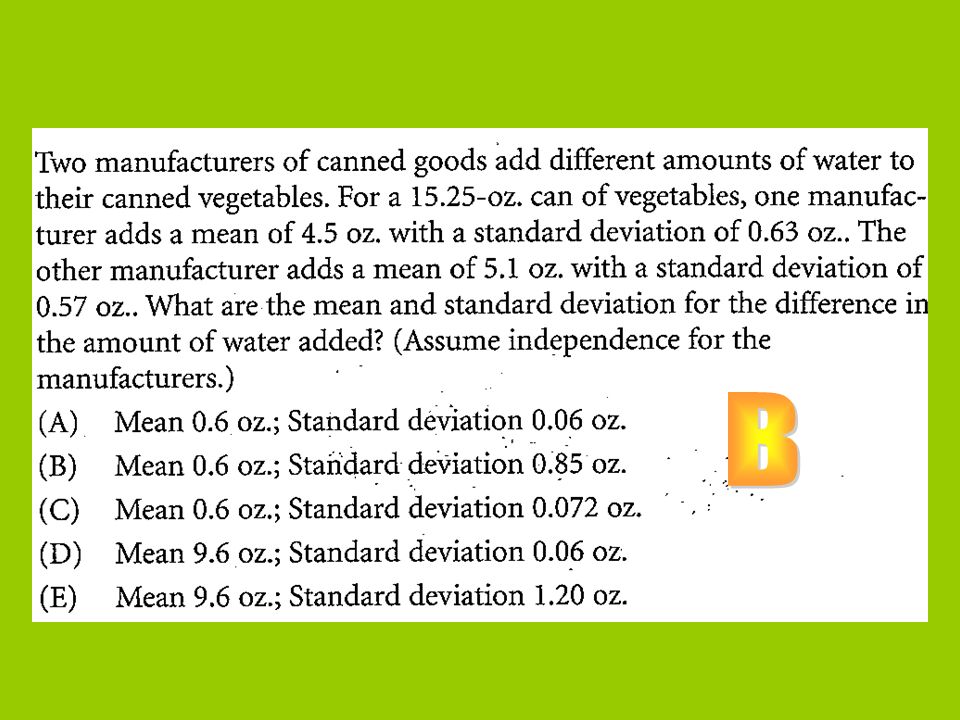
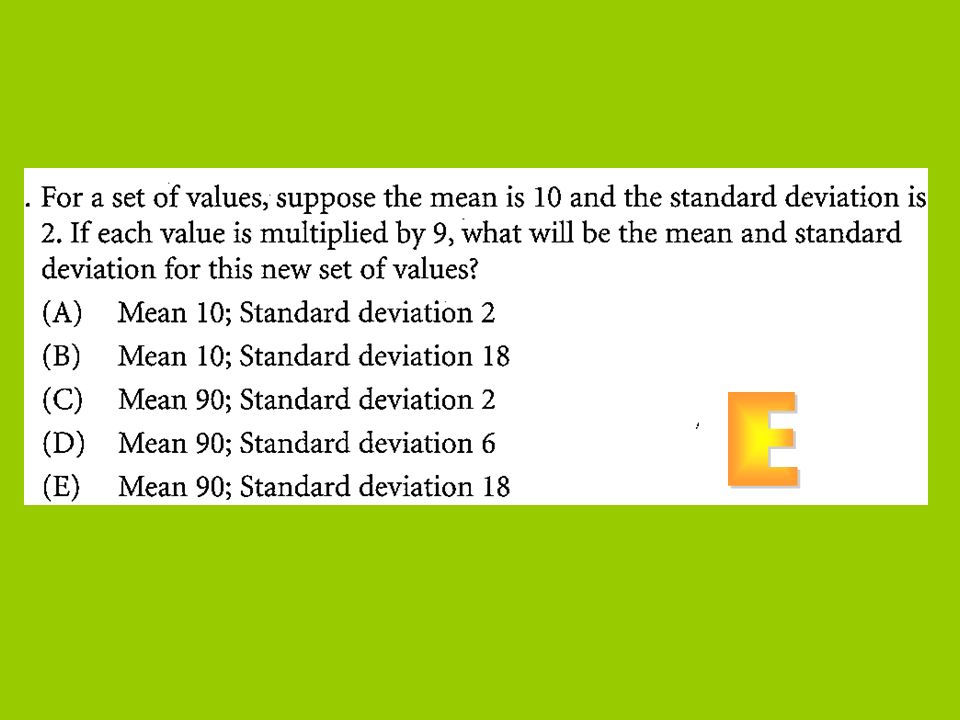
Random Variables –Expected Value –Standard Deviation –Means & Variances Factors –Change mean & variance Addends –Change mean but not variance Combining Random Variables –Means Add or Subtract –Always add variances

30
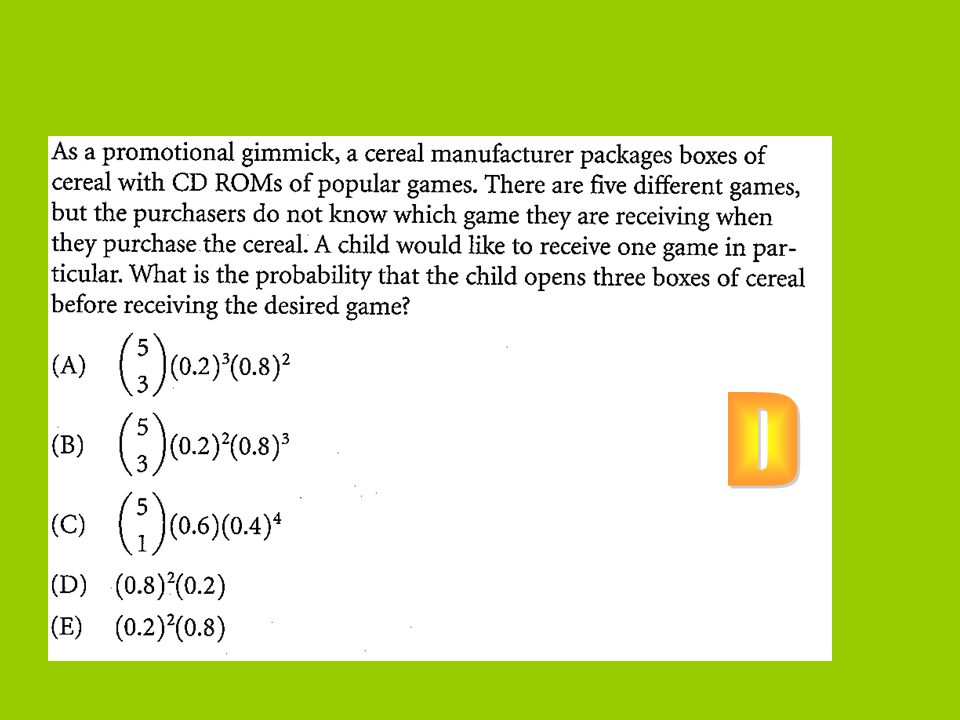
Probability Models –Geometric When do we see the first success??? Conditions Expected Value & SD –Binomial k successes in n trials Conditions Expected Value & Standard Deviation

53
Write the hypothesis & conditions for the following… –1 Proportion z-test –2 Proportion z-Test –1 Sample t-test –2 Sample t-test –Paired Data –Chi-Squared Family of Tests –Slope of regression line

67
M.C. Tips Underline key words Write out your procedure Dont Rush Balance your time (2-3 min per ???)
.")
68
F.R. Tips Do easier ???s first Answer the ??? Asked (underline) If miss 1 part, answer a part you know Inference: Conditions/Mechanics/Conclusion Be concise Verify conditions (not just a checklist) 2 decimal places for z-scores, 4 for p-values Context is King!!!
 If miss 1 part, answer a part you know Inference: Conditions/Mechanics/Conclusion Be concise Verify conditions (not just a checklist) 2 decimal places for z-scores, 4 for p-values Context is King!!!.")
69
Multiple Choice Answers

Similar presentations


 AP Statistics.>")


