Download presentation
Presentation is loading. Please wait.

1
SCIENCE, POLICY AND FUTURE COLORADO RIVER COMPACT ISSUES Presented by Eric Kuhn Colorado River Water Conservation District

2
OVERVIEW OF THE 1922 COLORADO RIVER COMPACT Compact divides the Colorado River, including all tributaries, into an Upper and Lower Basin. The boundary between the two basins is Lee Ferry, Arizona The Lower Division states are Nevada, California and Arizona. The Upper Division states are Wyoming, Colorado, New Mexico and Utah. Arizona, Utah and New Mexico have lands within both basins.

4
THE HYDROLOGIC GUTS OF THE COMPACT ARE IN ARTICLE III III (a). “There is hereby apportioned... in perpetuity to the Upper Basin and to the Lower Basin... the exclusive beneficial consumptive use of 7,500,000 af per annum... ” III (b). “In addition to... paragraph (a) the Lower Basin is hereby given the right to increase its beneficial consumptive use...by one million af per annum.”
. In addition to... paragraph (a) the Lower Basin is hereby given the right to increase its beneficial consumptive use...by one million af per annum. .")
5
III (c). Provides that water for Mexico “shall be supplied first from the waters over and above... paragraphs (a) and (b); and if such surplus shall prove insufficient... the burden... shall be equally borne by the Upper Basin and the Lower Basin and the Upper Division states shall deliver at Lee Ferry water to supply (its obligation)... in addition to that provided in paragraph (d). III (d). The states of the Upper Division will not cause the flow... at Lee Ferry to be depleted below an aggregate of 75,000,000 af for any ten consecutive years... ”
 and (b); and if such surplus shall prove insufficient... the burden... shall be equally borne by the Upper Basin and the Lower Basin and the Upper Division states shall deliver at Lee Ferry water to supply (its obligation)... in addition to that provided in paragraph (d). III (d). The states of the Upper Division will not cause the flow... at Lee Ferry to be depleted below an aggregate of 75,000,000 af for any ten consecutive years... .")
6
THE MEXICAN TREATY OF 1944 Article X. guarantees an annual delivery of 1.5 maf per annum. Provides for an additional.2 maf per annum when there is a surplus. Allows the United States to reduce deliveries during an “extraordinary drought” by the same proportions as consumptive uses in the USA are reduced.

7
THE 1948 UPPER COLORADO RIVER BASIN COMPACT Provides Arizona with 50,000 af per annum, with the remainder as follows: 51.75 % to Colorado 23.00 % to Utah 14.00 % to Wyoming 11.25 % to New Mexico “Consumptive use” is defined as man-made depletions to the native (virgin) flow at Lee Ferry. NOTE: this definition includes CRSP Reservoir evaporation.

8
TWO MAJOR UNRESOLVED COMPACT ISSUES THAT IMPACT COLORADO’S AVAILABLE COLORADO RIVER WATER SUPPLY The conflict between Articles III (a) and III (d) - which is controlling? Stated in other words: Must the Upper Basin have to forgo a portion of its 7.5 maf III(a) supply to deliver the 75 maf/10 years as required by III(d)? Do the Lower Basin tributaries, especially the Gila, have a share in the obligation to meet the Mexican Treaty deliveries?
 supply to deliver the 75 maf/10 years as required by III(d). Do the Lower Basin tributaries, especially the Gila, have a share in the obligation to meet the Mexican Treaty deliveries .")
9
WHY IS THIS IMPORTANT? Because it impacts Colorado’s available water supply, and thus, our future. Depending on the hydrologic Compact assumptions concerning the available water supply: - Colorado has either a lot of water to develop - upwards of another million acre feet, - OR - - Colorado may already be at or above full development of its Colorado River supplies.

10
HOW MUCH COLORADO RIVER WATER IS COLORADO CURRENTLY USING? Every five years the Secretary of the Interior publishes the Colorado River System Consumptive Uses and Losses Report. Thirty years of data are available; the latest report covers 1996-2000. There are a lot of critics of the report. The CWCB and River District staff believe it overstates Colorado irrigation uses in certain years. Other critics believe it understates Upper Basin irrigation uses. HOWEVER, until revised (if ever) it is the official record of the Secretary of the Interior.
 it is the official record of the Secretary of the Interior..")
13
CONCLUSION Based on the Consumptive Uses and Losses Reports and including Colorado’s share of CRSP reservoir evaporation: COLORADO IS CONSUMING IN THE RANGE OF 2.5 to 2.8 maf PER ANNUM. Likewise; THE UPPER BASIN STATES ARE USING IN THE RANGE OF 4.5 to 5.0 maf PER ANNUM.

14
HOW MUCH WATER IS AVAILABLE FOR COLORADO TO USE? This depends ultimately on how the compact issues are resolved, AND The assumptions we make on how much water is available, where its diverted in the Upper Basin, AND The basic assumptions on inflow to Lake Powell, which is highly variable.

15
DIFFERENT SCENARIOS 1) Noah’s estimate:.5175 X (7,500,000 – 50,000) = 3,855,000 af 2) Reclamation’s hydrologic determination: Based on the 1954-1965 hydrology (Reclamation assumes a 12.18 maf average inflow to Lake Powell) Assumes a Lee Ferry delivery of 8.25 maf/annum (7.5 maf for the Lower Basin plus 750k for Mexico)..5175 X (6,000,000 – 50,000) = 3,079,000 af 3) The 1965 hydrology with no deliveries from Upper Basin to Mexico – approximately 3,450,000 af.
 Noah’s estimate:.5175 X (7,500,000 – 50,000) = 3,855,000 af 2) Reclamation’s hydrologic determination: Based on the hydrology (Reclamation assumes a maf average inflow to Lake Powell) Assumes a Lee Ferry delivery of 8.25 maf/annum (7.5 maf for the Lower Basin plus 750k for Mexico) X (6,000,000 – 50,000) = 3,079,000 af 3) The 1965 hydrology with no deliveries from Upper Basin to Mexico – approximately 3,450,000 af.")
16
OTHER STUDIES In 1965, Tipton and Kalmbach did a study for the UCRC (used 1931 – 1964 hydrology). This study concluded that if the Lee Ferry annual delivery is 8.25 maf, the Upper Basin’s share (after CRSP evap) could be as low as 4.8 maf. With evaporation, this equates to a COLORADO SHARE OF 2,716,875 af per annum.
 could be as low as 4.8 maf. With evaporation, this equates to a COLORADO SHARE OF 2,716,875 af per annum..")
17
THE OCTOBER 1995 WATER RESOURCES BULLETIN OF AWRA PUBLISHED A SERIES OF ARTICLES ON SEVERE SUSTAINED DROUGHT IN THE SOUTHWEST A paper authored by Ben Harding, Taiye Sangoyomi and Elizabeth Payton modelled the Colorado River Basin based on a reconstructed drought from 1579 to 1616 and 1992 depletion levels. “Lake Powell contents were drawn down to dead storage by the end of year 18. Active storage in Lake Powell was zero for eight years.”

18
SOBERING THOUGHTS Based on reconstructed flows from tree ring studies, Stockton and Jacoby (1976) suggest there are a number of extended periods when inflow to Lake Powell was less than the 1954 to 1965 period. Can you imagine the impacts to this region if, for a period of six years, projects such as the CB-T, Dillon Reservoir, Fry-Ark, Moffat Tunnel Collection System, Homestake, Twin Lakes, Wolford, Dallas Creek, Dolores and Central Utah Project, San Juan-Chama, etc., could not legally divert a drop of water?

19
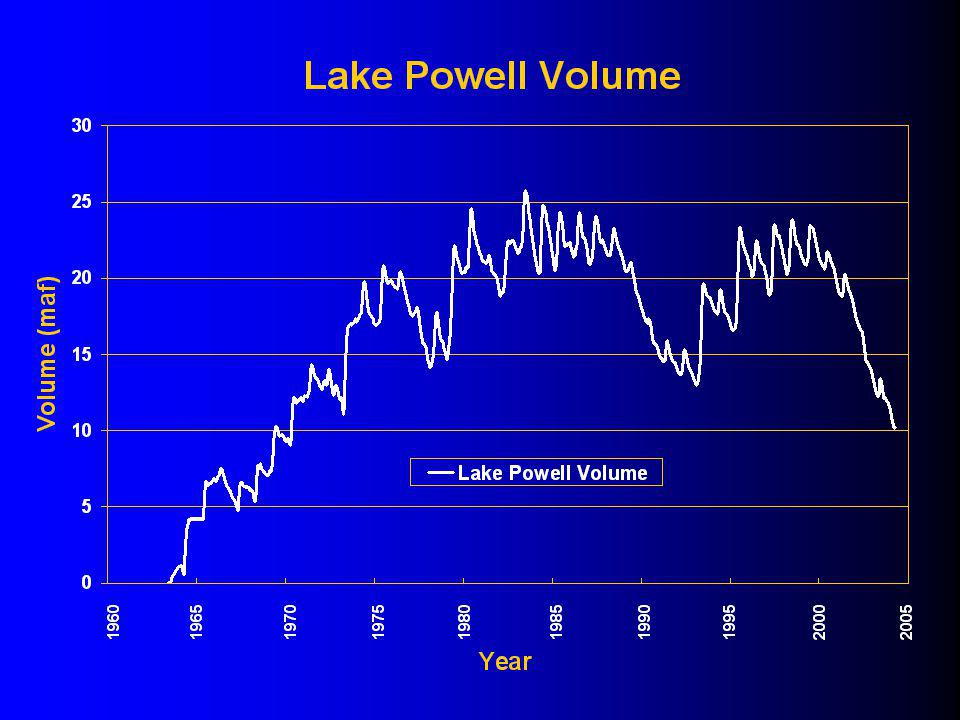
HAVE YOU NOTICED WHAT IS HAPPENING AT LAKE POWELL LATELY? The latest 24-month study shows that Lake Powell levels will drop for the fifth straight year to 8.1 MAF by March 2005. Are we now in a hydrologic period that will ultimately be drier than the 1954 to 1965 period? I’ve ignored all the buzz about global warming scenarios. But 2004 was the record early date for the Granby ice melt, the previous record was in 2002.

21
What does science tell us about the Colorado River and its future? Can we rely on past hydrology to describe the future with sufficient reliability to make reasonable plans? What are the policy implications of changing conditions on the Colorado River?

22
from USGS Fact Sheet 3062-04

23
The Bureau of Reclamation, Denver Water, Aurora, the CWCB, and almost every other major basin water provider uses modelling based on the historical record. Is this a wise process? If not, what are the alternatives?

24
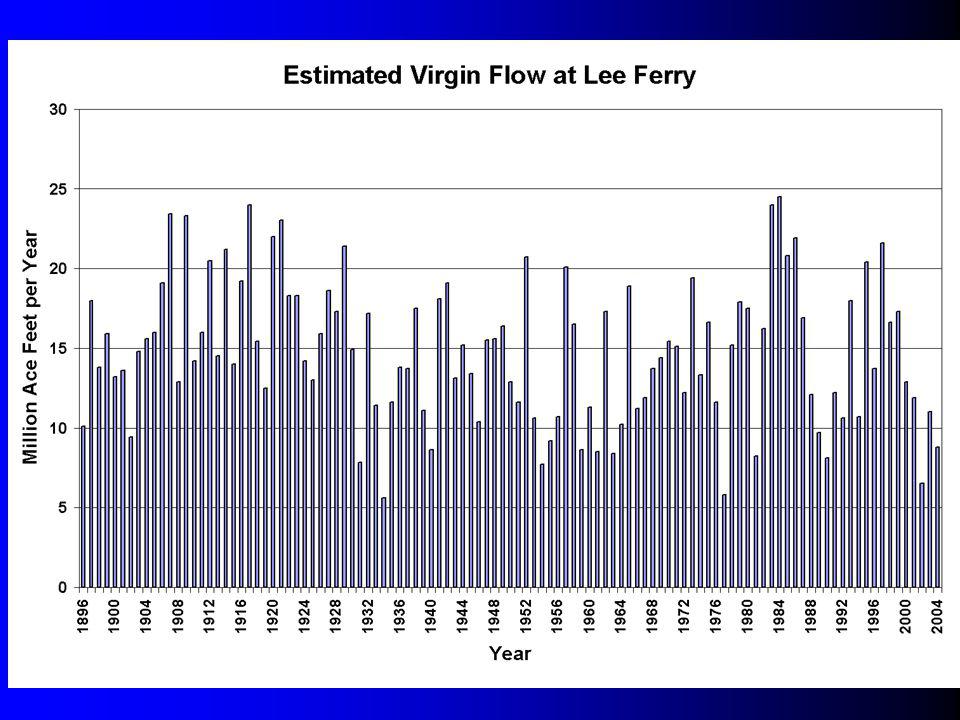
SOURCES Virgin Flow at Lee’s Ferry – Annual Reports of the Upper Colorado River Commission (I estimated 2004) Atlantic Multidecadal Oscillation Index – Pacific and Atlantic Ocean Influences on Multidecadal Drought Frequency in the United States - by McCabe, Palecki and Betauccert Mean Annual Northern Hemisphere Temperature Data - by Climate Research Unit, East Anglia U.K.
 Atlantic Multidecadal Oscillation Index – Pacific and Atlantic Ocean Influences on Multidecadal Drought Frequency in the United States - by McCabe, Palecki and Betauccert Mean Annual Northern Hemisphere Temperature Data - by Climate Research Unit, East Anglia U.K.")
28
Graph 20 Year CV

29
Graph 10 Year CV

30
Graph 30 Year CV

31
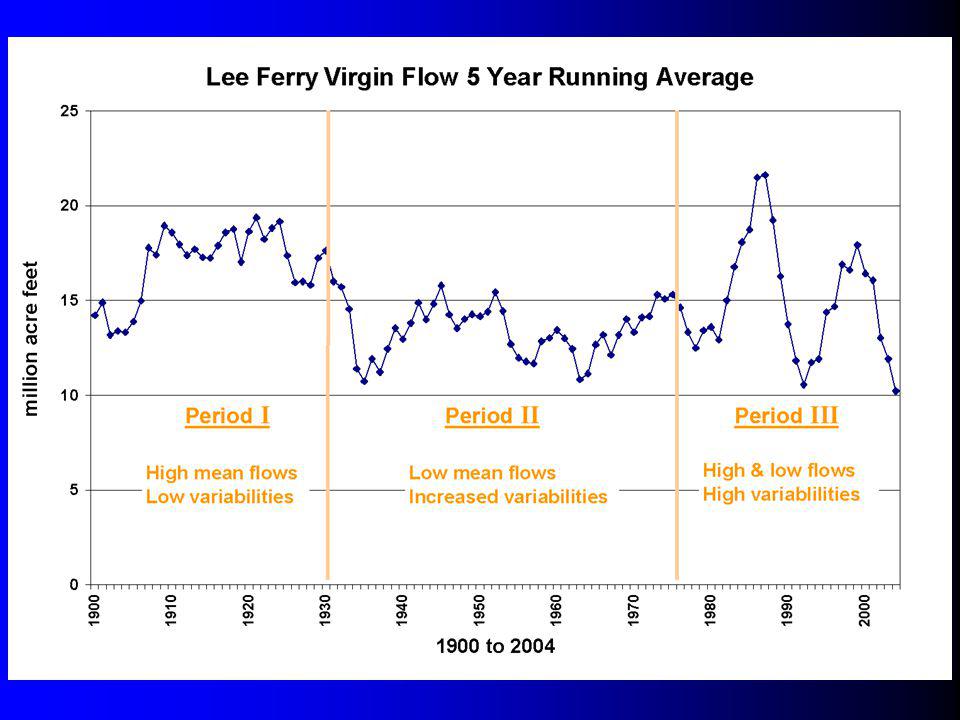
To About 1930 Period I Early 1900s To About 1930 Period II 1931 To The Early 1970’s To Present Period III Early 1970’s To Present The undepleted flows, climate conditions, challenges and river politics during each of these periods were all very different. THE COLORADO RIVER GAGE HISTORY CAN BE DIVIDED INTO THREE DISTINCT PERIODS

32
High flows 17.2 maf/yr 0 flow at Lee Ferry Low variability CV =.235 Flooding a major concern on the lower river Compact negotiations were based on an assumption of ample water Period I: 1900’s to 1930 1900’s to 1930

33
Low flows 13.3 maf/yr 0 flow at Lee Ferry Increasing variability CV =.281 Experienced the 1930’s & 1950’s extended droughts It was a time of rapid development: – C-BT Project (motivated by the ‘30’s drought) – Moffat Tunnel & Dillon Reservoir – CRSP Act – which resulted in Lake Powell, Aspinall, Flaming Gorge & Navajo Reservoirs – Authorization of CAP & CUP Increased awareness of environmental issues; salinity control, endangered species and Clean Water Act For most lower Colorado users it was a time of plenty, California used Arizona & Nevada’s unused water 1944 Mexican Water Treaty Period II: 1931 to the early 1970’s 1931 to the early 1970’s
 – Moffat Tunnel & Dillon Reservoir – CRSP Act – which resulted in Lake Powell, Aspinall, Flaming Gorge & Navajo Reservoirs – Authorization of CAP & CUP Increased awareness of environmental issues; salinity control, endangered species and Clean Water Act For most lower Colorado users it was a time of plenty, California used Arizona & Nevada’s unused water 1944 Mexican Water Treaty Period II: 1931 to the early 1970’s 1931 to the early 1970’s")
34
Moderate 0, 14.6 maf/yr, about the same as the long term average High variability CV =.349 High highs -& low lows - the early 1980’s high flows - the 2000 to 2004 drought Nevada & Arizona reached full development trigging the California 4.4 Plan & ISGs. Upper Basin, Lower Basin, & San Juan Recovery Programs Federal Government phases out of the water development business. Period III: 1970’s to present 1970’s to present

35
Several recent scientific articles suggest possible large scale climate reasons dominated each period. Atlantic Multidecadal Oscillation Departure Index and Average Northern Hemisphere temperatures are major factors. The ENSO (El Niño) and Pacific Decadal Oscillators were also factors, but were localized.
 and Pacific Decadal Oscillators were also factors, but were localized..")
36
AMO Departures

37
from Climate Research Unit, Norwich, UK (Modified)
")
Similar presentations