Download presentation
Presentation is loading. Please wait.

1
AWRA Annual Meeting: 2011 Albuquerque, NM Session: New Water Resources of NM and Obstacles to their Development 1:30 – 3:00 Monday, Nov 7 ”Economic Costs of Sustaining Water Supplies: Findings From the Rio Grande Basin” Frank A. Ward NM State University College of Agricultural, Consumer, and Environmental Sciences NM Water Resources Research Institute

2
Ongoing Challenges in RG Basin Adaptation to droughts, floods, climate change Search for resilient water institutions where there are complex watershed processes and constraints – Agronomic – Hydrologic – Meteorologic – Economic – Political Search for Just, Flexible, Open Water Policies Understandable Science-informed policy

3
Road Map Describe Potential Benefits of Comprehensive Basin Analysis (CBA) Brief history of Rio Grande Compact Describe principles how CBA can inform sustainable water policies. Show how CBA can inform water sharing debates Illustrate the use of CBA for policy analysis: sustaining RG Basin’s aquifers/reservoirs Conclusions

4
Uses of Comprehensive Basin Scale Analysis (CBA) CBA can provide data to inform debates on: – Adaptation to floods, drought, climate change – Ways to share transboundary waters – Irrigation water conservation subsidies – New knowledge or method (e.g., evaporation, ET) – Socially just, economically efficient, politically acceptable water infrastructure – Effective development planning – Cost effective Payment for Environmental Services
 CBA can provide data to inform debates on: – Adaptation to floods, drought, climate change – Ways to share transboundary waters – Irrigation water conservation subsidies – New knowledge or method (e.g., evaporation, ET) – Socially just, economically efficient, politically acceptable water infrastructure – Effective development planning – Cost effective Payment for Environmental Services")
5
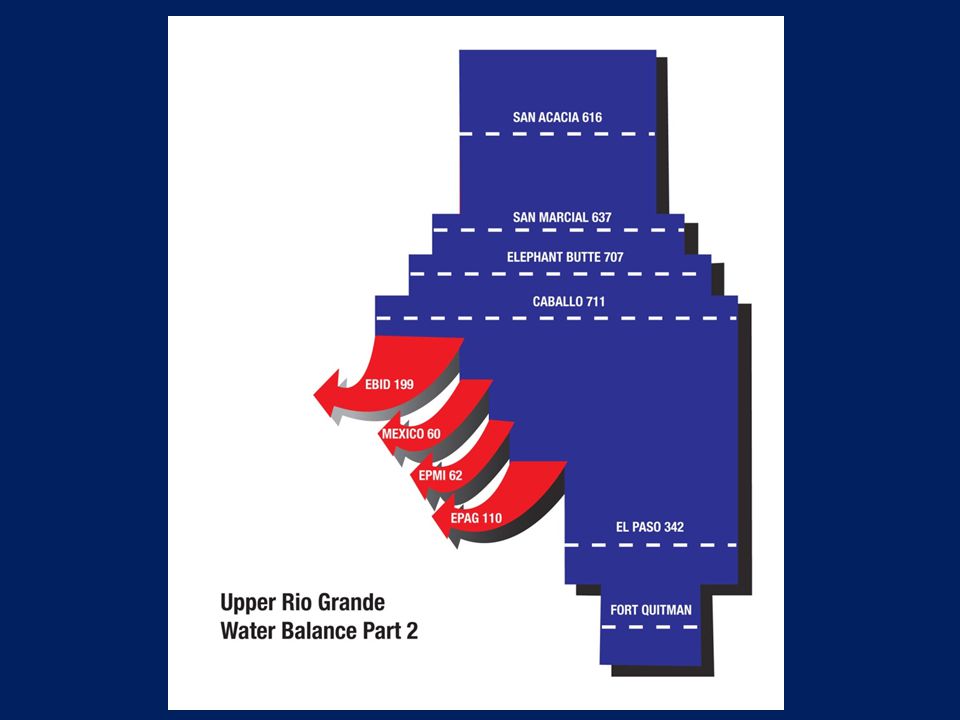
Simple Graphics to inform complex watershed policy debates: Sankey Chart Watersheds are scientifically complex Policy debates add complexity Few simple graphics can show the choices

6
Water Balance: Rio Grande Rio Grande from Colorado (USA) to US-Mexico border with supplies, gauged flows and depletions by location Impacts of wet, normal, dry inflows Must abide by existing water institutions – Rio Grande Compact – US Endangered Species Act – US Mexico Treaty of 1906 – New Mexico – Texas water sharing agreement (2008)
 to US-Mexico border with supplies, gauged flows and depletions by location Impacts of wet, normal, dry inflows Must abide by existing water institutions – Rio Grande Compact – US Endangered Species Act – US Mexico Treaty of 1906 – New Mexico – Texas water sharing agreement (2008)")
9
Limits of Graphics, Need for Models Economic and policy goals: sustainability, sustainable diversion reductions, resilient institutions, minimum econ losses from drought, flood, climate change So we use mathematical models of hydrology, agronomy, economics, and institutions for RG Basin

10
Water sharing arrangement hammered out for Rio Grande 9 years debate, experiment, negotiation (29-38) Signed in 1938 Based on a creative combination of: – Observing historical use patterns – Mathematical formula for predicting historical use – Formula explained how historical use varied in wet v. dry years. – Formula was applied to share water for the future in wet and dry conditions.

11
Rio Grande Compact (Approximate) Water Sharing Formula CO agreed deliveries to NM (1000 af/yr) NM agreed deliveries to TX (1000 af/yr)
 Water Sharing Formula CO agreed deliveries to NM (1000 af/yr) NM agreed deliveries to TX (1000 af/yr)")
12
Role of CBA to Inform Water Policy Proposals Historical outcomes by state, use, location, and period under actual water policies – Inflows: headwater supplies – Hydrologic: streamflows, reservoir levels – Agricultural: Irrigated land, farm income, yields, prodn, food self sufficiency – Urban: population, per capita use, price, supply reliability – Environmental: key ecological assets – Economic: Total economic benefits

13
Role of CBA to Inform Water Policy Proposals Historical outcomes by country, use, location, and period under potential water policy A – Inflows: headwater supplies – Hydrologic: streamflows, reservoir levels – Agricultural: Irrigated land, farm income, yields, prodn, food self sufficiency – Urban: population, per capita use, price, supply reliability – Environmental: key ecological assets – Economic: Total economic benefits

14
Role of CBA to Inform Water Policy Proposals Future outcomes by country, use, location, and period under actual water policies – Inflows: headwater supplies – Hydrologic: streamflows, reservoir levels – Agricultural: Irrigated land, farm income, yields, prodn, food self sufficiency – Urban: population, per capita use, price, supply reliability – Environmental: key ecological assets – Economic: Total economic benefits

15
Role of CBA to Inform Water Policy Proposals Future outcomes by country, use, location, and period under potential water policy A – Inflows: headwater supplies – Hydrologic: streamflows, reservoir levels – Agricultural: Irrigated land, farm income, yields, prodn, food self sufficiency – Urban: population, per capita use, price, supply reliability – Environmental: key ecological assets – Economic: Total economic benefits

16
Use of a CBA Impacts of alternative policy, supplies, or population by country, use, location, period. – Inflow differences: historic v potential – Hydrologic differences: historic v. potential – Agricultural differences: historic v. potential – Urban differences: historic v. potential – Environmental differences:historic v. potential – Economic differences: Benefits of new policy compared to historic policy. How these changes in benefits vary by alternative future supplies or future populations

18
Example Structure of CBA: Rio Grande Basin: CO, NM, TX

19
19 Objective

20
Irrigable land, Headwater supplies Sustain key ecological assets Hydrologic balance Reservoir starting levels (sw, gw) Reservoir sustainability constraints (sw, gw) Institutional – Endangered Species Act – Rio Grande Compact (CO-NM; NM-TX) – US Mexico Treaty of 1906 – Rio Grande Project water sharing history (NM/TX) 20 Constraints
 Reservoir sustainability constraints (sw, gw) Institutional – Endangered Species Act – Rio Grande Compact (CO-NM; NM-TX) – US Mexico Treaty of 1906 – Rio Grande Project water sharing history (NM/TX) 20 Constraints")
21
21 Ag water use

22
22 Institutions: e.g. Rio Grande Compact

23
Example Results: Rio Grande Basin Policy 1 -- Sustain natural water capital over a 20 year period: aquifers to starting levels, no requirement for reservoirs Policy 2 -- Increase natural water capital over a 20 year period: aquifers to starting levels, reservoirs to 90% of capacity

24
Table 1 : Change from Base Policy in Hydrologic, Agronomic, and Economic Outcomes: Sustaining and Renewing Natural Capital, Upper RG, 2010-29 Units Total, Three Basin States From Sustaining Natural Capital From Renewing Natural Capital Hydrologic Outcome 1000 ac-ft/yr -198.1-16%-218.7-19% Water Consumed (ET) Agronomic Outcome 1000 ac -87.3-27%-94.8-31% Cropland in Prodn Economic Outcome $US 1000/yr Total Net Benefits -34,384-6%-62,048-11% From Water Use -33,710-6%-64,868-12% From Water Environment -674-4%2,82014%
 Agronomic Outcome 1000 ac % % Cropland in Prodn Economic Outcome $US 1000/yr Total Net Benefits -34,384-6%-62,048-11% From Water Use -33,710-6%-64,868-12% From Water Environment %2,82014%")
25
Conclusions: Overcoming Obstacles to Sustaining NM’s Water Supplies Information Needs – Economic value of water Agriculture Urban Environment – Cost of Water Conservation Irrigated agriculture – subsidies Urban Use -- subsidies Water pricing: farms, cities, environment

26
Conclusions: Overcoming Obstacles to Sustaining NM’s Water Supplies Needs for Policies/Institutions – Complete NM’s Stream Adjudications, Especially Middle and Lower Rio Grande – Build and use resilient institutions for adapting to drought, climate change

Similar presentations