Download presentation
Presentation is loading. Please wait.

1
SPIE (2005) Vol. 5755_16 TEA Systems, Inc. Terrence E. Zavecz – TEA Systems Inc. http://www.TEAsystems.com March 3, 2005 Full-Field feature profile models in process control Contact tzavecz@TEAsystems.comtzavecz@TEAsystems.com (+01) 610 682 4146 SPIE (2005) Vol 5755 - 16
 SPIE (2005) Vol")
2
SPIE (2005) Vol. 5755_16 TEA Systems, Inc. March. 2005Models for reticle performancePage -2- Introduction ?Physical Process Window description and Perturbations The Best Focus Feature Contour ?Formalization ?Removal of metrology and exposure systematic error ?Examples Duty Cycle BARC High k1 applications Full-Field Process Window ?Optimum Field Response With tool defocus removed Depth of Focus & Focus Contours Application to Full-Wafer responses ?Formalization ?Addressing Film and Feature systematic ?Exposure tool artifacts Final Note ?Exposure artifact influence on the Process Window Conclusions Introduction ?Physical Process Window description and Perturbations The Best Focus Feature Contour ?Formalization ?Removal of metrology and exposure systematic error ?Examples Duty Cycle BARC High k1 applications Full-Field Process Window ?Optimum Field Response With tool defocus removed Depth of Focus & Focus Contours Application to Full-Wafer responses ?Formalization ?Addressing Film and Feature systematic ?Exposure tool artifacts Final Note ?Exposure artifact influence on the Process Window Conclusions Models for Reticle Performance

3
SPIE (2005) Vol. 5755_16 TEA Systems, Inc. March. 2005Models for reticle performancePage -3- Two-variable process window The number of un-Collapsed lines visible in a group were rated from SEM photos ranging from 0 to 7 Results are shown for an 80 nm feature width BCD Collapsed line

4
SPIE (2005) Vol. 5755_16 TEA Systems, Inc. March. 2005Models for reticle performancePage -4- Properties of the PW Surface C. Ausschnitt et al SPIE 5378 p38-47 C. Mack et al SPIE 5038-39 C. Ausschnitt et al SPIE 5378 p38-47 C. Mack et al SPIE 5038-39

5
SPIE (2005) Vol. 5755_16 TEA Systems, Inc. March. 2005Models for reticle performancePage -5- CD-SEM with PW CD vs Dose CD vs Focus Optimum Focus (for this case) deFocus 1.CD vs Dose is not linear 2.Surface fit quality can vary!
 deFocus 1.CD vs Dose is not linear 2.Surface fit quality can vary!.")
6
SPIE (2005) Vol. 5755_16 TEA Systems, Inc. March. 2005Models for reticle performancePage -6- Why Process Window fit-quality varies? Primary disturbances causing CD Uniformity (CDU) variations grouped upon their sources. ReticleScannerTrack & Process Effective Focus Wafer flatness Device topography Substrate BARC coat Resist Film coat PEB Temp & Time Develop Exposure Dose Slit Uniformity FocusSetUp Chuck Flatness Up-Down Scan CDU Effective Dose Scan Linearity CDs Flatness Transmission
 variations grouped upon their sources. ReticleScannerTrack & Process Effective Focus Wafer flatness Device topography Substrate BARC coat Resist Film coat PEB Temp & Time Develop Exposure Dose Slit Uniformity FocusSetUp Chuck Flatness Up-Down Scan CDU Effective Dose Scan Linearity CDs Flatness Transmission.")
7
SPIE (2005) Vol. 5755_16 TEA Systems, Inc. March. 2005Models for reticle performancePage -7- Best Focus – Feature Contour Derive CD @ Dose & Best Focus Relationship functional for ?Feature Widths ?Side Wall Angle (SWA) ?Resist & BARC thickness ?Line Edge Roughness Best Focus (for Critical Dimension or CD) Set derivative = 0 & solve for F CD @ Best Focus
 Resist & BARC thickness Line Edge Roughness Best Focus (for Critical Dimension or CD) Set derivative = 0 & solve for F Best Focus.")
8
SPIE (2005) Vol. 5755_16 TEA Systems, Inc. March. 2005Models for reticle performancePage -8- Dose Response of Best Focus (BF) & CD Feature vs Dose ?Will be near-linear if feature profiles are well resolved Best Focus vs Dose ?Slope should be ~0 if lens is near aberration free and films do not influence focus response Best Focus Dose
 & CD Feature vs Dose Will be near-linear if feature profiles are well resolved Best Focus vs Dose Slope should be ~0 if lens is near aberration free and films do not influence focus response Best Focus Dose.")
9
SPIE (2005) Vol. 5755_16 TEA Systems, Inc. March. 2005Models for reticle performancePage -9- Example #1 – Duty cycle 140 nm contacts 3 sets of pitch CD-SEM measured p240 p550 p420 TCL=140nm contact Best Focus

10
SPIE (2005) Vol. 5755_16 TEA Systems, Inc. March. 2005Models for reticle performancePage -10- Example 2: BARC Performance The ARC 3 data has ?a lower CD vs dose, reducing its sensitivity to dose ?A greater target dose to obtain CD size of 80 nm ?A strong sensitivity of best focus to the dose ARC3 at Best DoseNo ARC at Best Dose

11
SPIE (2005) Vol. 5755_16 TEA Systems, Inc. March. 2005Models for reticle performancePage -11- Example #3; Pushing the envelope Dose values are arbitrary At 80 nm, we are driving the imaging capabilities of the lens Note response of BF to scan & lens aberrations Response is caused by wavefront asymmetry and results in feature line edge asymmetry Site 15 Site 30 Response for 80 nm, 193 litho process

12
SPIE (2005) Vol. 5755_16 TEA Systems, Inc. March. 2005Models for reticle performancePage -12- Consider the Process Window A CD-SEM based data sample of the process window

13
SPIE (2005) Vol. 5755_16 TEA Systems, Inc. March. 2005Models for reticle performancePage -13- Scatterometry Process Window Side Wall Angle What can we learn? Dose= 18 19 20 21 22 23 24 Focus -0.24 -0.16 -0.08 0.0 +0.08 +0.16 +0.24 Process Window Exposures 193nm litho process for 100nm features –AT1100 scanner, 0.75NA with annular illumination –90nm gratings at 1:1 with full field coverage –240nm resist on 78nm Barc on Si OCD metrology: NI, rotating polarized light (Nano9030) diffractive optical metrology (scatterometry) - outputs spectral intensity changes of 0 th order diffracted light intensity ?Weir PW Software from TEA Systems
 diffractive optical metrology (scatterometry) - outputs spectral intensity changes of 0 th order diffracted light intensity Weir PW Software from TEA Systems.")
14
SPIE (2005) Vol. 5755_16 TEA Systems, Inc. March. 2005Models for reticle performancePage -14- Optimal BCD Image BCD values as estimated for the reticle Across-field Focus and metrology errors removed by process Note that these values include both reticle offsets and exposure/lens aberrations BCD Contour Plot X (slit) location (mm) Y (scan) location (mm) BCD Vector Plot 100 nm 1:1, 90nm TCD
 location (mm) Y (scan) location (mm) BCD Vector Plot 100 nm 1:1, 90nm TCD.")
15
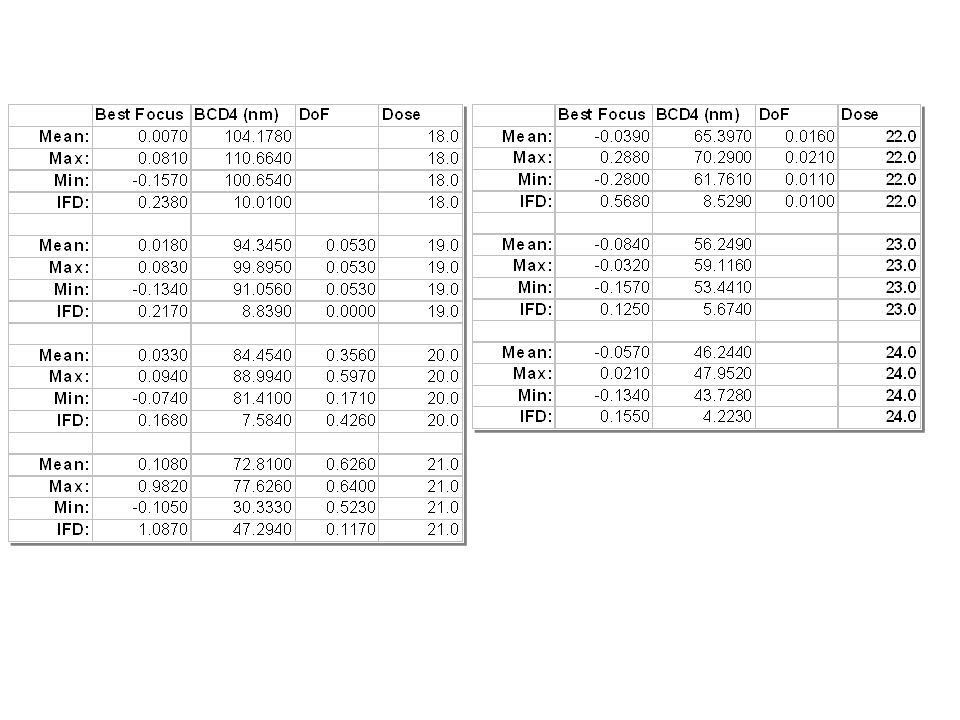
SPIE (2005) Vol. 5755_16 TEA Systems, Inc. March. 2005Models for reticle performancePage -15- Optimum Field Response thru Dose BCD summarizes natural feature size response @ best Focus for each dose DoF computed when in control

16
SPIE (2005) Vol. 5755_16 TEA Systems, Inc. March. 2005Models for reticle performancePage -16- Metrology & Process Independent Characteristics Focus Uniformity Depth of Focus Uniformity

17
SPIE (2005) Vol. 5755_16 TEA Systems, Inc. March. 2005Models for reticle performancePage -17- CD-SEM Reticle MEF+ = 4.3292 Optimized BCD from Wafer Nanometrics Reticle MEF+ = 4.305813 Validation; wafer vs Reticle 5754-110 Poster

18
SPIE (2005) Vol. 5755_16 TEA Systems, Inc. March. 2005Models for reticle performancePage -18- BCD, TCD, SWA @ Best Focus/Dose

19
SPIE (2005) Vol. 5755_16 TEA Systems, Inc. March. 2005Models for reticle performancePage -19- BARC modeled wafer uniformity Dusa et al. SPIE Vol. 5378-11

20
SPIE (2005) Vol. 5755_16 TEA Systems, Inc. March. 2005Models for reticle performancePage -20- T3 (PR) TCD SWA BARC Derived variable distributions across the wafer BCD
 TCD SWA BARC Derived variable distributions across the wafer BCD.")
21
SPIE (2005) Vol. 5755_16 TEA Systems, Inc. March. 2005Models for reticle performancePage -21- BCD & TCD Size vs PhotoResist

22
SPIE (2005) Vol. 5755_16 TEA Systems, Inc. March. 2005Models for reticle performancePage -22- BARC Thickness & SWA

23
SPIE (2005) Vol. 5755_16 TEA Systems, Inc. March. 2005Models for reticle performancePage -23- Focus = -1.5 -1.0 -0.05 0.0 +0.05 +1.0 1.5 - + - + - + - + - + - + - + Reticle Scan Direction + - Scan Direction Artifacts

24
SPIE (2005) Vol. 5755_16 TEA Systems, Inc. March. 2005Models for reticle performancePage -24- Profile variation with Focus Bottom CD Slope Top CD - + - + - + - + - + - + - + Focus = -1.5 -1.0 -0.05 0.0 +0.05 +1.0 +1.5 - + - + - + - + - + - + - + Scan direction Process window Lens After cleaningLens Before cleaning See Poster: 5754-87

25
SPIE (2005) Vol. 5755_16 TEA Systems, Inc. March. 2005Models for reticle performancePage -25- Slope vs Dose across the slit 5 18 19 6 Lens After cleaningLens Before cleaning 9 10 11 12 Up +Scan Down -Scan

26
SPIE (2005) Vol. 5755_16 TEA Systems, Inc. March. 2005Models for reticle performancePage -26- Reticle Scan Removed Bottom CD Slope Top CD Reticle scan-stage component removed. Provides view of lens perturbations - + - + - + - + - + - + - + Focus = -1.5 -1.0 -0.05 0.0 +0.05 +1.0 +1.5 - + - + - + - + - + - + - + Focus = -1.5 -1.0 -0.05 0.0 +0.05 +1.0 +1.5 Lens After cleaningLens Before cleaning

27
SPIE (2005) Vol. 5755_16 TEA Systems, Inc. March. 2005Models for reticle performancePage -27- Lens Slit Removed Bottom CD Slope Top CD - + - + - + - + - + - + - + Focus = -1.5 -1.0 -0.05 0.0 +0.05 +1.0 +1.5 Lens After cleaningLens Before cleaning - + - + - + - + - + - + - + Focus = -1.5 -1.0 -0.05 0.0 +0.05 +1.0 +1.5 Lens aberrations removed. Provides view of scan uniformity Scan speed nonlinearity start/end of scan - + - + - + - + - + - + - + - + - + - + - + - + - + - +

28
SPIE (2005) Vol. 5755_16 TEA Systems, Inc. March. 2005Models for reticle performancePage -28- FR(x,y) @ Best Focus CD response after field focus errors are removed. TopCD BottomCD Slope -Down + Up Lens After cleaningLens Before cleaning -Down + Up

29
SPIE (2005) Vol. 5755_16 TEA Systems, Inc. March. 2005Models for reticle performancePage -29- A Note: Exposure artifacts & the model Be aware of scan artifacts such as stage scan direction perturbations

30
SPIE (2005) Vol. 5755_16 TEA Systems, Inc. March. 2005Models for reticle performancePage -30- Summary Process Window surface models ?The algorithm history extends through several formats ?Extended to Dose Response of Features independent of metrology & Field focus ?Best Focus vs Dose Plot yields additional information on process response and extensibility Full-Field Process Window ?Provides the optimum feature response across the field ?Traceable directly to reticle measurements ?Can be extended to Depth of Focus and deFocus contours Full Wafer Response ?Implements Best Feature response of the Full-Field Process Window ?Models were shown for addressing wafer-systematic perturbations Scanner-specific field models shown in paper 5754-110 ?Systematic feature response perturbations Response to Film and and exposure tool artifacts ?Final Note Exposure tool induced perturbations can directly influence the accuracy of the process window calculation

31
SPIE (2005) Vol. 5755_16 TEA Systems, Inc. End of Presentation – Thank You Please visit posters: ?Feature profile control and the influence of scan artifacts 5754-87 ?Models for reticle performance and comparison of direct measurement 5754-110 Visit us at: http://www.TEAsystems.com BARC Uniformity

32
SPIE (2005) Vol. 5755_16 TEA Systems, Inc. March. 2005Models for reticle performancePage -32-
 Vol. 5755_16 TEA Systems, Inc. March. 2005Models for reticle performancePage -32-")
33
SPIE (2005) Vol. 5755_16 TEA Systems, Inc. Background and additional slides
 Vol. 5755_16 TEA Systems, Inc. Background and additional slides")
34
SPIE (2005) Vol. 5755_16 TEA Systems, Inc. March. 2005Models for reticle performancePage -34- (2) Formalization of the Spatial Signatures - IFp(x,y): IntraField periodic signature ?reticle component and a systematic –within-wafer, periodic component ?describing the scanner field (slit and scan signatures) - Wp (x,y): feature response variability ?This component is primarily a result of the whole-wafer-at-a- time process steps, characteristic to resist and track. - DD (x,y): Die-to-Die variability ?variations in discrete scanning disturbances such as effective dose, the incidental focus or scan direction. - r: the residual component (1) Feature Response to process disturbance m is the sensitivity coefficient Ref. 2: Mircea Dusa et al, Intra-wafer CDU characterization …, Proc. SPIE (2004), Vol. 5378-11 Most complex signature
 Formalization of the Spatial Signatures - IFp(x,y): IntraField periodic signature reticle component and a systematic –within-wafer, periodic component describing the scanner field (slit and scan signatures) - Wp (x,y): feature response variability This component is primarily a result of the whole-wafer-at-a- time process steps, characteristic to resist and track. - DD (x,y): Die-to-Die variability variations in discrete scanning disturbances such as effective dose, the incidental focus or scan direction. - r: the residual component (1) Feature Response to process disturbance m is the sensitivity coefficient Ref. 2: Mircea Dusa et al, Intra-wafer CDU characterization …, Proc. SPIE (2004), Vol Most complex signature.")
35
SPIE (2005) Vol. 5755_16 TEA Systems, Inc. March. 2005Models for reticle performancePage -35- Component Analysis of MEF Definition ?MEF = Mask Error Function ? In terms if IntraField Periodic Signature IF p (x,y) = IF d Reticle +IF Slit, scan aberrations + IF effective Dose,Focus + IF Resist + IF flare,scatter +If scatter MEF Objective: Identify the MEF Components of IF p
 = IF d Reticle +IF Slit, scan aberrations + IF effective Dose,Focus + IF Resist + IF flare,scatter +If scatter MEF Objective: Identify the MEF Components of IF p.")
36
SPIE (2005) Vol. 5755_16 TEA Systems, Inc. March. 2005Models for reticle performancePage -36- IntraField (IF p ) Signature IF slit Perturbations ?Lens aberrations ?Flare, scatter, proximity etc. ?Photoresist artifacts IF Scan Reticle Stage Distortions : ?effective dose scan speed ?Effective Focus Stage pitch, yaw tilt travel height-offset IF Reticle ? Effective feature width ? Photomask Processing IF slit = Lens Aberrations
 Signature IF slit Perturbations Lens aberrations Flare, scatter, proximity etc. Photoresist artifacts IF Scan Reticle Stage Distortions : effective dose scan speed Effective Focus Stage pitch, yaw tilt travel height-offset IF Reticle . Effective feature width . Photomask Processing IF slit = Lens Aberrations.")
37
SPIE (2005) Vol. 5755_16 TEA Systems, Inc. March. 2005Models for reticle performancePage -37- Lens-Slit Model, Row offsets Modeled offset of each slit position Repeatability of each reticle scans travel Contributing about 1 nm of noise to BCD error budget Focus offsets Lens-slit model is applied to every row of every field of the wafer. Results are summarized on the right.

38
SPIE (2005) Vol. 5755_16 TEA Systems, Inc. March. 2005Models for reticle performancePage -38-
 Vol. 5755_16 TEA Systems, Inc. March. 2005Models for reticle performancePage -38-")
39
SPIE (2005) Vol. 5755_16 TEA Systems, Inc. March. 2005Models for reticle performancePage -39- Right-side average

40
SPIE (2005) Vol. 5755_16 TEA Systems, Inc. March. 2005Models for reticle performancePage -40- Average Field

41
SPIE (2005) Vol. 5755_16 TEA Systems, Inc. March. 2005Models for reticle performancePage -41- BCD Raw Data

42
SPIE (2005) Vol. 5755_16 TEA Systems, Inc. March. 2005Models for reticle performancePage -42- Modeled BCD-RET across wafer

43
SPIE (2005) Vol. 5755_16 TEA Systems, Inc. March. 2005Models for reticle performancePage -43- Profile Response @ Best Focus (Before) UP +Scan Down -Scan Lens before cleaning
 UP +Scan Down -Scan Lens before cleaning.")
44
SPIE (2005) Vol. 5755_16 TEA Systems, Inc. March. 2005Models for reticle performancePage -44- Profile Response @ Best Focus (After) Lens After cleaning UP +ScanDown -Scan
 Lens After cleaning UP +ScanDown -Scan.")
45
SPIE (2005) Vol. 5755_16 TEA Systems, Inc. March. 2005Models for reticle performancePage -45- Focus Uniformity -Down + Up BottomCD TopCD Slope Lens After cleaningLens Before cleaning BottomCD Calculated from TopCD Slope -Down + Up Calculated from

46
SPIE (2005) Vol. 5755_16 TEA Systems, Inc. March. 2005Models for reticle performancePage -46- DoF Variation TopCD BottomCD After Clean Both features plot to the same scale Note however there is a problem with the lower left corner of the field with a shallow DoF ?Partially hidden here by the scale -Down + Up Lens After cleaningLens Before cleaning -Down + Up

47
SPIE (2005) Vol. 5755_16 TEA Systems, Inc. March. 2005Models for reticle performancePage -47- Lens-Slit Uniformity The piston BCD value of each columns yield a representation of the BCD perturbation caused by the lens. This is the Average Field Variation show is caused by the 8 focus-shifted fields Slit contributes about 2 nm to error budget

48
SPIE (2005) Vol. 5755_16 TEA Systems, Inc. March. 2005Models for reticle performancePage -48- Average Field BCD Scan Profile Boxplot across Reticle Scan shown Reticle & Wafer errors removed The right-side (bottom) of the scans mid-points has been averaged and transposed to the left-side (top) graph. ?Note the left-right pitch of the reticle- scans travel accounting for approximately 1 nm of variation Right-side average
 of the scans mid-points has been averaged and transposed to the left-side (top) graph. Note the left-right pitch of the reticle- scans travel accounting for approximately 1 nm of variation Right-side average.")
49
SPIE (2005) Vol. 5755_16 TEA Systems, Inc. March. 2005Models for reticle performancePage -49- Slit Wobble Slit-wobble is contributing about 1.25 nm to error budget Tilt contributes 3 nm to budget

50
SPIE (2005) Vol. 5755_16 TEA Systems, Inc. March. 2005Models for reticle performancePage -50- IntraField Process Window W(x,y) = Feature Response ?located at (x,y) on reticle Process window reduction Site #8 ?Soft data-sport ?Easily corrected and handled Site #6 response ?Reticle Error ?Lens and/or scan aberrations (MEF) Site #8 Site #6
 = Feature Response located at (x,y) on reticle Process window reduction Site #8 Soft data-sport Easily corrected and handled Site #6 response Reticle Error Lens and/or scan aberrations (MEF) Site #8 Site #6.")
51
SPIE (2005) Vol. 5755_16 TEA Systems, Inc. March. 2005Models for reticle performancePage -51- Models for reticle performance Introduction Formalized MEF derivation ?Influence of process and exposure ?Method of analysis Phase I ?Evaluation of effective focus & dose ?Full-profile response ?Characterization SEM, OCD ?MEF calculation from SEM & OCD Phase II ?Full wafer response ?Process variation analysis ?ARC volatility ?Response wrt theory of CD vs Arc Summary Process perturbation to feature profile error budget

52
SPIE (2005) Vol. 5755_16 TEA Systems, Inc. March. 2005Models for reticle performancePage -52- Focus uniformity Dose = 20 21 (isofocal) 22 23
")
53
SPIE (2005) Vol. 5755_16 TEA Systems, Inc. March. 2005Models for reticle performancePage -53- Experimental conditions Exposures typical 193nm litho process for 100nm features –AT1100 scanner, 0.75NA with annular illumination –90nm gratings at 1:1 with full field coverage –240nm resist on 78nm Barc on Si OCD metrology: NI, rotating polarized light (Nano9030) diffractive optical metrology (scatterometry) - outputs spectral intensity changes of 0 th order diffracted light intensity modeled grating parameters –bottom CD; –resist thickness (Tr) and Sidewall Angle (SWA) –bottom arc thickness (Tbarc) –mean square errror (MSE) Calculate BCD at optimum focus and dose ?Weir PW Software from TEA Systems ?Determine BCD surface across field with removal of focus errors
 diffractive optical metrology (scatterometry) - outputs spectral intensity changes of 0 th order diffracted light intensity modeled grating parameters –bottom CD; –resist thickness (Tr) and Sidewall Angle (SWA) –bottom arc thickness (Tbarc) –mean square errror (MSE) Calculate BCD at optimum focus and dose Weir PW Software from TEA Systems Determine BCD surface across field with removal of focus errors.")
54
SPIE (2005) Vol. 5755_16 TEA Systems, Inc. March. 2005Models for reticle performancePage -54- Center slit response Determine Best focus for each site from 1 st order derivative of each BCD vs Focus curve

55
SPIE (2005) Vol. 5755_16 TEA Systems, Inc. March. 2005Models for reticle performancePage -55- Analysis of Reticle-free CDs Wafer 177 ?New metrology tool ?Fixed focus with selected sites at +/-1% dF and +/-2% dF as shown Measured BCD, BARC, SWA & Photoresist 121 (11x11) points per field Measured field sites Layout with Focus offsets (in um) shown
 points per field Measured field sites Layout with Focus offsets (in um) shown.")
56
SPIE (2005) Vol. 5755_16 TEA Systems, Inc. March. 2005Models for reticle performancePage -56- BCD as measured Wafer damaged area Bad site measurement

57
SPIE (2005) Vol. 5755_16 TEA Systems, Inc. March. 2005Models for reticle performancePage -57- BCD with Reticle errors removed BCD variation from film, focus and exposure variations

58
SPIE (2005) Vol. 5755_16 TEA Systems, Inc. March. 2005Models for reticle performancePage -58- BCD-RET vs PhotoResist RET has been removed Typical CD vs photoresist thickness curve ?Illustrates the Photoresist ablation from exposure & develope

59
SPIE (2005) Vol. 5755_16 TEA Systems, Inc. March. 2005Models for reticle performancePage -59- BCD-RET vs BARC This is for the field edges.

60
SPIE (2005) Vol. 5755_16 TEA Systems, Inc. March. 2005Models for reticle performancePage -60- SWA vs BARC As expected, BARC thickness has a strong influence on the profile

61
SPIE (2005) Vol. 5755_16 TEA Systems, Inc. March. 2005Models for reticle performancePage -61- PW spatial view Target 90 nm feature +/- 10% EL Dose= 18 19 20 21 22 23 24 Focus -0.24 -0.16 -0.08 0.0 +0.08 +0.16 +0.24

62
SPIE (2005) Vol. 5755_16 TEA Systems, Inc. March. 2005Models for reticle performancePage -62- Focus-response Field Center Center-site of exposure for each dose

63
SPIE (2005) Vol. 5755_16 TEA Systems, Inc. March. 2005Models for reticle performancePage -63- Dose Response at best focus Optimum CD vs Dose curve for entire field Focus errors across slit have been removed Dose response is now linear ?This assumes a flat field since focus is optimized at each individual site

64
SPIE (2005) Vol. 5755_16 TEA Systems, Inc. March. 2005Models for reticle performancePage -64- Center Slit: Focus & DoF Response DoF = red Best Focus = blue Each site exhibits a unique value for optimum focus & Depth of Focus (DoF) Use Feature Size, independent of focus, to determine MEF 13 14 15 16 17 18
 Use Feature Size, independent of focus, to determine MEF")
65
SPIE (2005) Vol. 5755_16 TEA Systems, Inc. March. 2005Models for reticle performancePage -65- BCD final (nm) Reticle values have been removed from the BCD metrology Note residual of reticle image on gossly overexposed 24 mj column Dose= 18 19 20 21 22 23 24 Focus -0.24 -0.16 -0.08 0.0 +0.08 +0.16 +0.24 Invalid data
 Reticle values have been removed from the BCD metrology Note residual of reticle image on gossly overexposed 24 mj column Dose= Focus Invalid data.")
66
SPIE (2005) Vol. 5755_16 TEA Systems, Inc. March. 2005Models for reticle performancePage -66- BCD Final Field BCD values as estimated for the reticle Across-field Focus and metrology errors removed by process Note that these values include both reticle offsets and exposure/lens aberrations

67
SPIE (2005) Vol. 5755_16 TEA Systems, Inc. March. 2005Models for reticle performancePage -67- Average Hitachi Field

68
SPIE (2005) Vol. 5755_16 TEA Systems, Inc. March. 2005Models for reticle performancePage -68- Nanometrics OCD Measured Reticle Nanometrics OCD Direct measurement of Reticle 400 nm patterns X (slit) location (mm) Y (scan) location (mm)
 location (mm) Y (scan) location (mm).")
69
SPIE (2005) Vol. 5755_16 TEA Systems, Inc. March. 2005Models for reticle performancePage -69- Reticle Scan Model Field-by-field Reticle- Scan Model Wafer model removed

70
SPIE (2005) Vol. 5755_16 TEA Systems, Inc. March. 2005Models for reticle performancePage -70- Reticle-scan piston BCD Piston (offset) term for each modeled scan (column) Note the locations of the focus shifts and the corresponding shift in average field value ?Reaction may actually be more scan- direction dependant
 term for each modeled scan (column) Note the locations of the focus shifts and the corresponding shift in average field value Reaction may actually be more scan- direction dependant.")
71
SPIE (2005) Vol. 5755_16 TEA Systems, Inc. March. 2005Models for reticle performancePage -71- Models for reticle performance Introduction MEF Formaization ?Influence of process and exposure ?Method of analysis Phase I ?Evaluation of effective focus & dose ?Full-profile response ?Characterization SEM, OCD ?MEF calculation from SEM & OCD Phase II ?Full wafer response ?Process variation analysis ?ARC volatility ?Response CD vs Arc Summary Process perturbation to feature profile error budget

72
SPIE (2005) Vol. 5755_16 TEA Systems, Inc. March. 2005Models for reticle performancePage -72- BARC modeled wafer uniformity

73
SPIE (2005) Vol. 5755_16 TEA Systems, Inc. March. 2005Models for reticle performancePage -73- BCD vs BARC All exposures

74
SPIE (2005) Vol. 5755_16 TEA Systems, Inc. March. 2005Models for reticle performancePage -74- Residuals to modeled wafer

75
SPIE (2005) Vol. 5755_16 TEA Systems, Inc. March. 2005Models for reticle performancePage -75- Average Field BCD Slit Profile Boxplot across slit & Scan shown

76
SPIE (2005) Vol. 5755_16 TEA Systems, Inc. March. 2005Models for reticle performancePage -76- Row and Slit profile Nano-Day1 Data Slit & Scan signatures of tool Estimate of reticle errors ?Includes reticle plus focus & exposure perturbations Slit Signature Scan Signature

77
SPIE (2005) Vol. 5755_16 TEA Systems, Inc. March. 2005Models for reticle performancePage -77- Lens Slit Model – slit wobble BCD-RET data showing slit tilt or wobble during the scan sequence

78
SPIE (2005) Vol. 5755_16 TEA Systems, Inc. March. 2005Models for reticle performancePage -78- BCD Reticle-Scan Tilt & Curvature High BCD values at end of scan are most likely due to the slit- scan speed changes. Reticle-scanning is responsible for 1.7 nm of the BCD budget.

79
SPIE (2005) Vol. 5755_16 TEA Systems, Inc. Layouts for Figures in Text
 Vol. 5755_16 TEA Systems, Inc. Layouts for Figures in Text")
80
SPIE (2005) Vol. 5755_16 TEA Systems, Inc. March. 2005Models for reticle performancePage -80- W(x,y) = Feature Response ?located at (x,y) on reticle Process window reduction Site #8 ?Soft data-sport ?Easily corrected and handled Site #6 response ?Reticle Error ?Lens and/or scan aberrations (MEF) Site #8 Site #6
 = Feature Response located at (x,y) on reticle Process window reduction Site #8 Soft data-sport Easily corrected and handled Site #6 response Reticle Error Lens and/or scan aberrations (MEF) Site #8 Site #6.")
81
SPIE (2005) Vol. 5755_16 TEA Systems, Inc. March. 2005Models for reticle performancePage -81-
 Vol. 5755_16 TEA Systems, Inc. March. 2005Models for reticle performancePage -81-")
82
SPIE (2005) Vol. 5755_16 TEA Systems, Inc. March. 2005Models for reticle performancePage -82- Dose Response at best focus Optimum CD vs Dose curve for entire field Focus errors across slit have been removed Dose response is now linear ?This assumes a flat field since focus is optimized at each individual site

83
SPIE (2005) Vol. 5755_16 TEA Systems, Inc. March. 2005Models for reticle performancePage -83- Average Field BCD Scan Profile Boxplot across Reticle Scan shown Reticle & Wafer errors removed The right-side (bottom) of the scans mid-points has been averaged and transposed to the left-side (top) graph. ?Note the left-right pitch of the reticle- scans travel accounting for approximately 1 nm of variation Right-side average
 of the scans mid-points has been averaged and transposed to the left-side (top) graph. Note the left-right pitch of the reticle- scans travel accounting for approximately 1 nm of variation Right-side average.")
84
SPIE (2005) Vol. 5755_16 TEA Systems, Inc. March. 2005Models for reticle performancePage -84- Analysis of Reticle-free CDs Wafer 177 ?New metrology tool ?Fixed focus with selected sites at +/-1% dF and +/-2% dF as shown Measured BCD, BARC, SWA & Photoresist 121 (11x11) points per field Measured field sites Layout with Focus offsets (in um) shown
 points per field Measured field sites Layout with Focus offsets (in um) shown.")
85
SPIE (2005) Vol. 5755_16 TEA Systems, Inc. March. 2005Models for reticle performancePage -85- BCD as measured Wafer damaged area Bad site measurement

86
SPIE (2005) Vol. 5755_16 TEA Systems, Inc. March. 2005Models for reticle performancePage -86- BCD with Reticle errors removed BCD variation from film, focus and exposure variations

87
SPIE (2005) Vol. 5755_16 TEA Systems, Inc. March. 2005Models for reticle performancePage -87- BCD-RET vs PhotoResist RET has been removed Typical CD vs photoresist thickness curve ?Illustrates the Photoresist ablation from exposure & develope

88
SPIE (2005) Vol. 5755_16 TEA Systems, Inc. March. 2005Models for reticle performancePage -88- BCD-RET vs BARC This is for the field edges.

89
SPIE (2005) Vol. 5755_16 TEA Systems, Inc. March. 2005Models for reticle performancePage -89- Lens-Slit Model, Row offsets Modeled offset of each slit position Repeatability of each reticle scans travel Contributing about 1 nm of noise to BCD error budget Focus offsets Lens-slit model is applied to every row of every field of the wafer. Results are summarized on the right.

90
SPIE (2005) Vol. 5755_16 TEA Systems, Inc. March. 2005Models for reticle performancePage -90- Focus offsets

91
SPIE (2005) Vol. 5755_16 TEA Systems, Inc. March. 2005Models for reticle performancePage -91- Lens Slit Model – slit wobble BCD-RET data showing slit tilt or wobble during the scan sequence

92
SPIE (2005) Vol. 5755_16 TEA Systems, Inc. March. 2005Models for reticle performancePage -92- Slit Wobble Slit-wobble is contributing about 1.25 nm to error budget Tilt contributes 3 nm to budget

93
SPIE (2005) Vol. 5755_16 TEA Systems, Inc. March. 2005Models for reticle performancePage -93- SWA; Residuals to wafer model Note fine structure, due to scan?

94
SPIE (2005) Vol. 5755_16 TEA Systems, Inc. March. 2005Models for reticle performancePage -94- Mean Field Values BCDTCDSWA T2(ARC)T3 (PR)MSE
T3 (PR)MSE.")
95
SPIE (2005) Vol. 5755_16 TEA Systems, Inc. March. 2005Models for reticle performancePage -95- Raw MSE & PR

96
ARC3 at Best DoseNo ARC at Best Dose

97
Site 15 Site 30

98
Dose= 18 19 20 21 22 23 24 Focus -0.24 -0.16 -0.08 0.0 +0.08 +0.16 +0.24 Process Window CD-SEM SWA - Scatterometry

99
BCD values as estimated for the reticle Across-field Focus and metrology errors removed by process Note that these values include both reticle offsets and exposure/lens aberrations BCD Contour Plot X (slit) location (mm) Y (scan) location (mm) BCD Vector Plot 100 nm 1:1, 90nm TCD
 location (mm) Y (scan) location (mm) BCD Vector Plot 100 nm 1:1, 90nm TCD")
101
CD-SEM Reticle MEF+ = 4.3292 Optimized BCD from Wafer Nanometrics Reticle MEF+ = 4.305813

102
Focus Uniformity Depth of Focus Uniformity

103
T3 (PR) TCD SWA BARC BCD
 TCD SWA BARC BCD")
106
Bottom CD Top CD - + - + - + - + - + - + - + Focus = -1.5 -1.0 -0.05 0.0 +0.05 +1.0 +1.5 - + - + - + - + - + - + - + Focus = -1.5 -1.0 -0.05 0.0 +0.05 +1.0 +1.5 Lens After cleaningLens Before cleaning Slope

107
Bottom CD Slope (SWA) Top CD - + - + - + - + - + - + - + Focus = -1.5 -1.0 -0.05 0.0 +0.05 +1.0 +1.5 Lens After cleaningLens Before cleaning - + - + - + - + - + - + - + Focus = -1.5 -1.0 -0.05 0.0 +0.05 +1.0 +1.5 Scan speed nonlinearity start/end of scan - + - + - + - + - + - + - + - + - + - + - + - + - + - +
 Top CD Focus = Lens After cleaningLens Before cleaning Focus = Scan speed nonlinearity start/end of scan")
Similar presentations


 Grants Chapter 6.>")
