Download presentation
Presentation is loading. Please wait.

2
11 P 2 : Proficiency & Progress 2011 Using Data to Think & Do Things Differently Dr. Ron Costello Superintendent of Catholic Schools Archdiocese of Indianapolis rcostello@archindy.org Phone: 317-236-1486

3
“When you start looking at reform, I think the pressure on school systems actually has been advantageous--but only to point. It’s been a wake-up call but not enough people are out of bed yet.” -- Dr. Michael Fullan

4
Continuous School Improvement and Assessment Literacy Capacity to examine student data and make sense of it. Ability to make changes in teaching and schools derived from those data. Commitment to engage in external assessment discussions. Michael Fullan

5
4 Presentation Goals What we want to do today is: Introduce you to the Archdiocesan Performance Report – Data Analysis Convince using to use data to support your case for your school. This is a must in this era of school accountability (impact of vouchers); and, Make you aware of the data that is already available to the public about your Catholic school.
; and, Make you aware of the data that is already available to the public about your Catholic school..")
6
2011 School Performance Report Archdiocese of Indianapolis

7
Faith Dimension/Catholic Identity Results of the parents survey concerning a school’s Catholic identity. Results indicate support parents have for the mission of your school. Schools should use the results in their annual performance report. The information is included in PILLARS.

8
2011 - FAITH 2000 Results

12
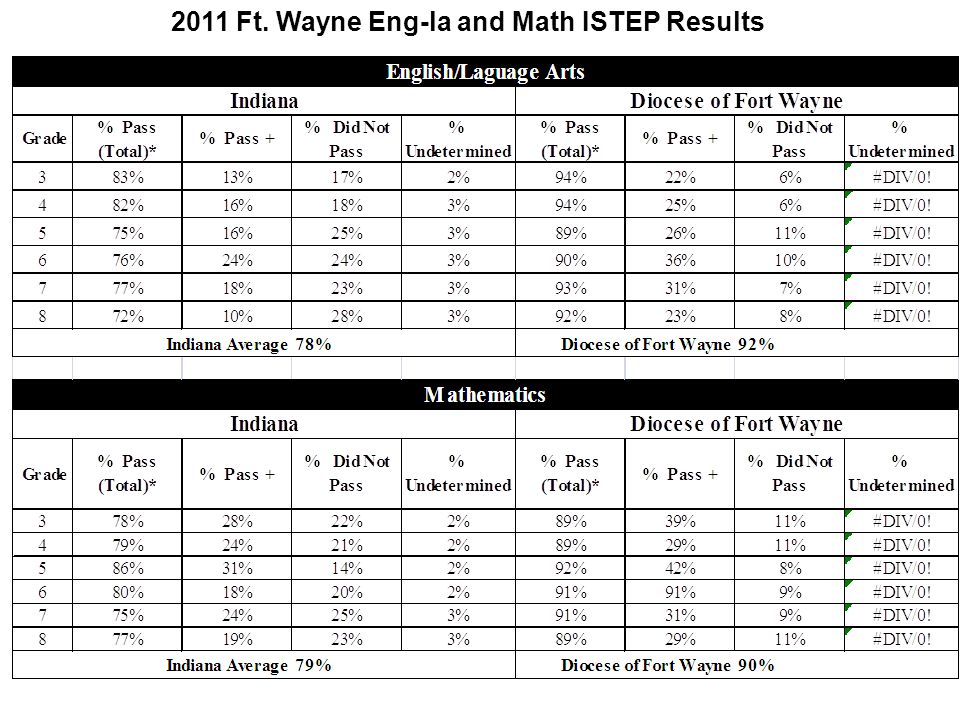
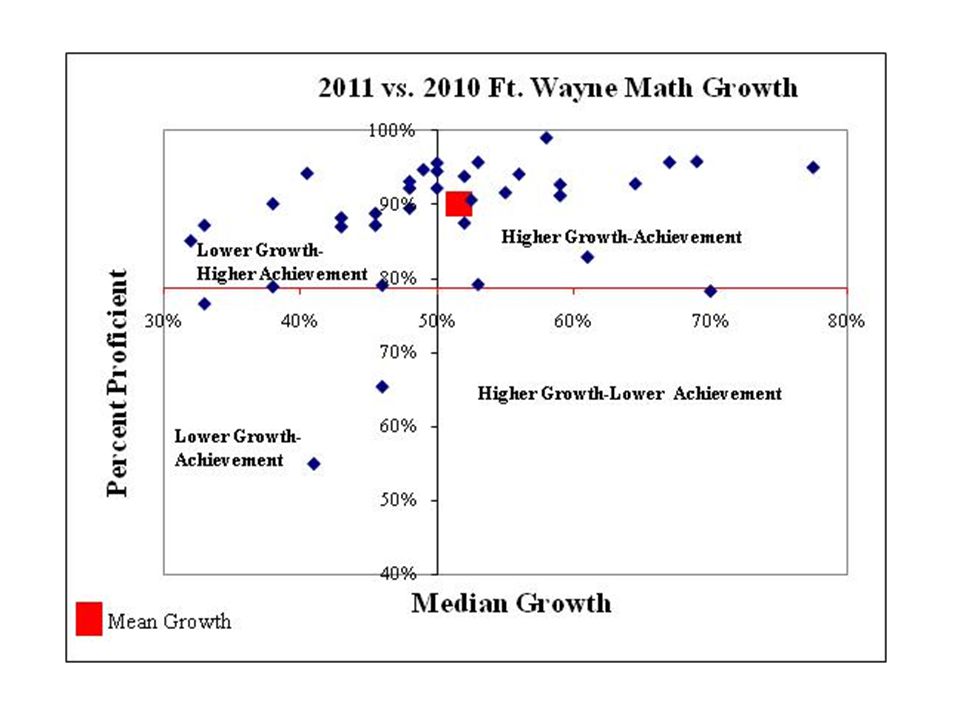
2011 Ft. Wayne Eng-la and Math ISTEP Results

13
Indiana Department of Education Determining AYP Initial goal (starting point- 2002, 2003, and 2004 tests) –English – 58.8%Math – 57.1% 2005, 2006, and 2007 tests (for three years) –English – 65.7%Math – 64.3% 2008, 2009, and 2010 tests (for three years) English – 72.6%Math – 71.5% Intermediate goals at equal increments for: –2011 test English – 79.5%Math – 78.7% –2012 test English – 86.4%Math – 85.9% –2013 test English – 93.3%Math – 93.1% All students (100%) are expected to be at “proficient” or “Pass” level on 2014 test (data for 2013-2014 school year)
 –English – 58.8%Math – 57.1% 2005, 2006, and 2007 tests (for three years) –English – 65.7%Math – 64.3% 2008, 2009, and 2010 tests (for three years) English – 72.6%Math – 71.5% Intermediate goals at equal increments for: –2011 test English – 79.5%Math – 78.7% –2012 test English – 86.4%Math – 85.9% –2013 test English – 93.3%Math – 93.1% All students (100%) are expected to be at proficient or Pass level on 2014 test (data for school year)")
14
Indiana School Improvement & Performance Categories for Schools Not Meeting AYP Goals Performance Exemplary Progress Commendable Progress Academic Progress Academic Watch (Priority) Academic Probation (High Priority) ≥90% Exemplary School ≥80%≥1% Commendable School ≥70% ≥3% ≥2% ≥1% <1% ≥60% ≥4% ≥3% ≥2% <2% ≥50% ≥5% ≥4% ≥3% ≥0% <0% ≥40% ≥6%≥5%≥4%≥1%<1% <40% ≥6% ≥5% ≥3% <3% Improvement from Fall to Fall
 Academic Probation (High Priority) ≥90% Exemplary School ≥80%≥1% Commendable School ≥70% ≥3% ≥2% ≥1% <1% ≥60% ≥4% ≥3% ≥2% <2% ≥50% ≥5% ≥4% ≥3% ≥0% <0% ≥40% ≥6%≥5%≥4%≥1%<1% <40% ≥6% ≥5% ≥3% <3% Improvement from Fall to Fall")
17
Don Deshler 2006

18
17 Proficiency versus Progress Proficiency Measures a student’s achievement at a single point in time Relates to a student’s family background Compares achievement to a standard Critical to a student’s post secondary opportunities Progress Measures a student’s progress between two points in time Not related to a student’s family background Compares students’ performance to their own prior performance Critical to ensuring a student’s future academic success A more complete picture of Student Learning

19
18 What is a Value-Added Progress Metric? Battelle – “Toolkit for School Leaders”

20
19 Why Value-Added? - Measuring Are both student making appropriate academic growth? Battelle – “Toolkit for School Leaders”

21
20 Assessment Error – Bill Sanders Simple Analysis with complete data … Same data without 2 lowest scores …

22
21 Value-Added Test Properties Tests must: –Be highly correlated to curricular objectives –Have sufficient stretch –Have appropriate levels reliability Battelle – “Toolkit for School Leaders”

23
22 Value-Added Assessment All students deserve the opportunity to achieve Less than a year’s progress puts at student risk Growth can be measured and reported on an annual basis William Sanders 1996

24
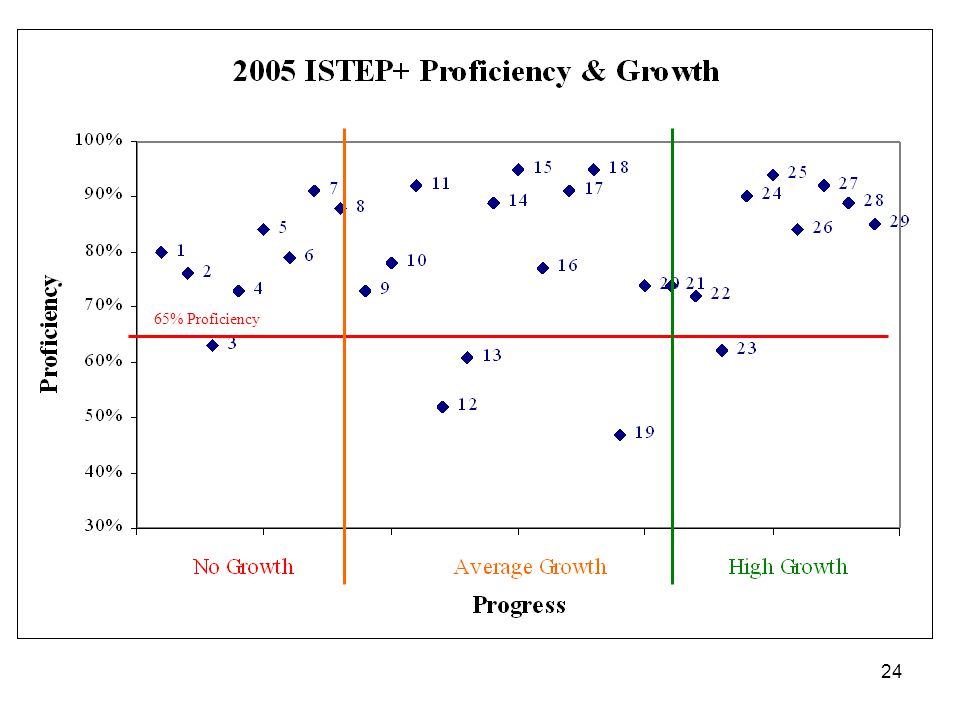
23 Possible School Outcomes Low Proficiency Low Growth High Proficiency Low Growth High Proficiency High Growth Low Proficiency High Growth ProficiencyProficiency Growth Theodore Hershberg Value-Added Assessment and Systemic Reform, PDK, Dec. 2005
25
24 65% Proficiency

32
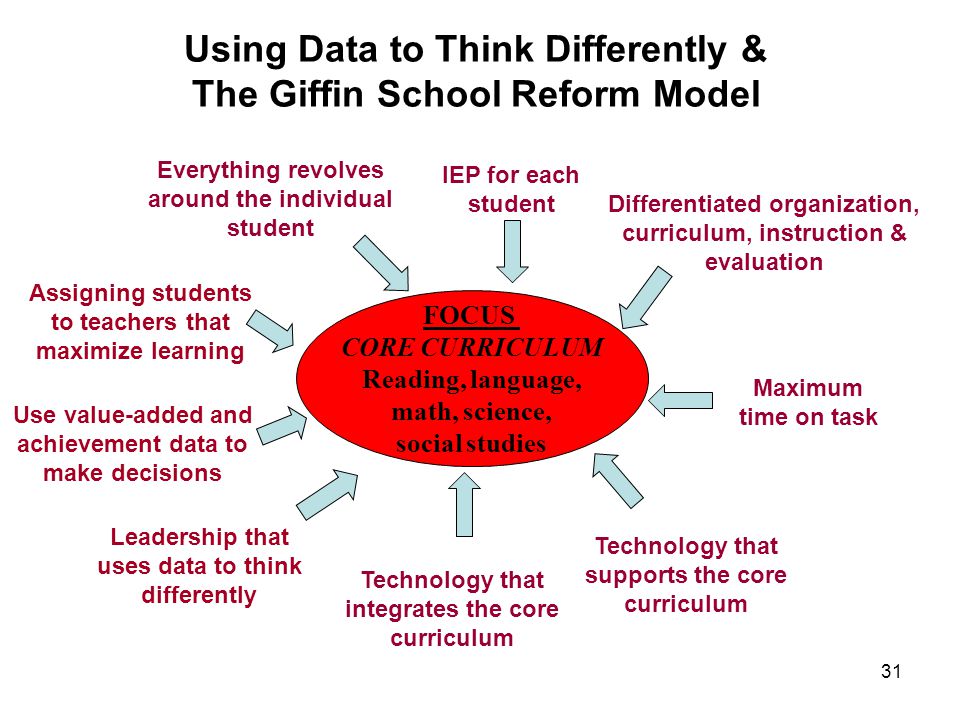
31 FOCUS CORE CURRICULUM Reading, language, math, science, social studies Using Data to Think Differently & The Giffin School Reform Model Everything revolves around the individual student IEP for each student Differentiated organization, curriculum, instruction & evaluation Maximum time on task Technology that supports the core curriculum Technology that integrates the core curriculum Use value-added and achievement data to make decisions Leadership that uses data to think differently Assigning students to teachers that maximize learning

33
32 Others Ways To Use Data to Think & Do Things Differently 1.Matching teaching strengths to student needs 2.Implementing interventions for students not making learning progress 3.Designing a Multi-Layered Differentiated Curriculum to challenge and engage each student 4.Developing an Individualized Educational Plan (IEP) for every student 5.Creating a Master Schedule that provides more time, the right teachers, different class sizes and different curricula to maximize each student’s learning!
 for every student 5.Creating a Master Schedule that provides more time, the right teachers, different class sizes and different curricula to maximize each student’s learning!")
34
School Name2010 PL 221 Category 2011 PL 221 Category 2011 Performance 2011 Improvement ArchdioceseExemplary 93.11.6

35
School Name2010 PL 221 Category 2011 PL 221 Category 2011 Performance 2011 Improvement Ft. WayneExemplary 89.3%2.3%

38
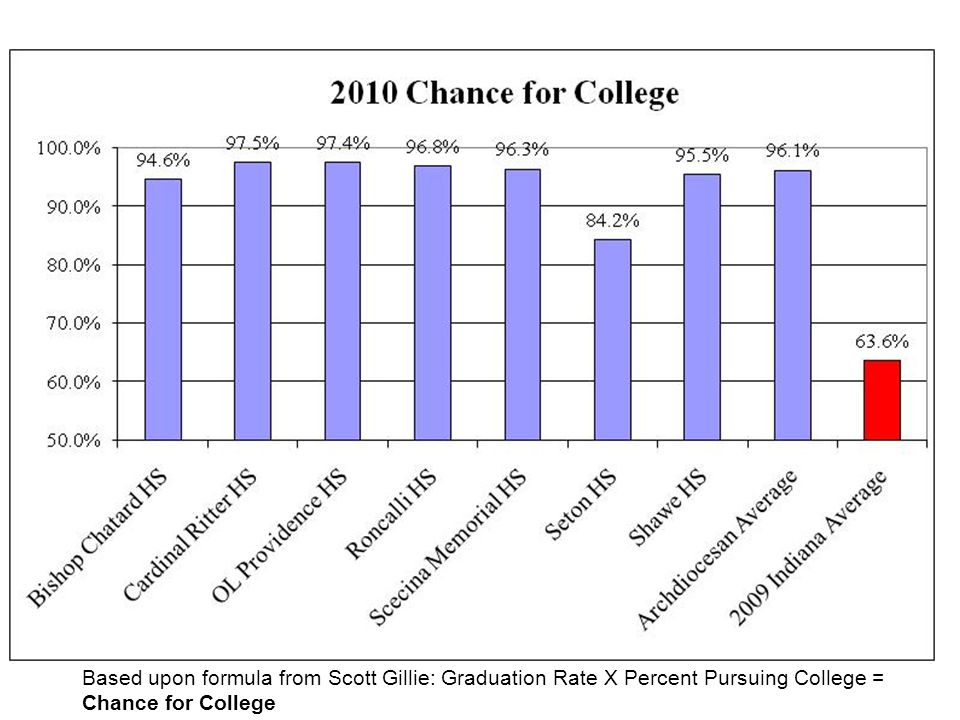
Based upon formula from Scott Gillie: Graduation Rate X Percent Pursuing College = Chance for College

40
39 Questions / Comments 1.Are there any questions about the ways we are introducing for how to use value- added data? 2.Are there any questions about how to interpret and better understand your school’s value-added results?

41
Teaching the Values of the Roman Catholic Church Getting Students Into Our Schools Keeping Students in Our Schools Our Schools are Accountable for Student Proficiency& Progress!

42
Catholic Identity Academics Total school – Advancement and Development Effort Improving Catholic School Vitality - ACT

43
For additional school information Contact: Dr. Ron Costello or Kathy Mears Name: Office of Catholic Education School: Archdiocese of Indianapolis Address: 1400 N. Meridian Street City, State, Zip: Indianapolis, IN 46202 Phone: 317-236-1430 email: rcostello@archindy.orgrcostello@archindy.org kmears@archindy.org

Similar presentations


 An Overview. Resources Policy Guidance NCLB Brochures>")


 1990 1991 1992 1993 1994 1995 1996 1997 1998 1999 2000 2001 2002 2003 2004 2005 2006 2007 2008 2009 2010 2011 Issue date National Student.>")


 (less level 1 & 2 students) (less level 3 students in full transition) (less students in full.>")


 U.S. Department of Education Adapted by TEA September 2003.>")
 (Your School/Departments SMART Goals Here)>")
