Download presentation
Presentation is loading. Please wait.

1
“White Flight” in London and the UK? Eric Kaufmann and Gareth Harris, Birkbeck College, University of London e.kaufmann@bbk.ac.uk

2
Save our Census! The permission of the Office for National Statistics to use the Longitudinal Study is gratefully acknowledged, as is the help provided by staff of the Centre for Longitudinal Study Information & User Support (CeLSIUS). CeLSIUS is supported by the ESRC Census of Population Programme (Award Ref: ES/K000365/1). The authors alone are responsible for the interpretation of the data. Census output is Crown copyright and is reproduced with the permission of the Controller of HMSO and the Queen's Printer for Scotland. The results presented are based on a test version of the LS database incorporating 2011 Census data. Figures may be subject to change when the final version of this database is released in November 2013.
. CeLSIUS is supported by the ESRC Census of Population Programme (Award Ref: ES/K000365/1). The authors alone are responsible for the interpretation of the data. Census output is Crown copyright and is reproduced with the permission of the Controller of HMSO and the Queen s Printer for Scotland. The results presented are based on a test version of the LS database incorporating 2011 Census data. Figures may be subject to change when the final version of this database is released in November")
3
Community and Closure 'Neighborhoods can be open only if countries are at least potentially closed...The distinctiveness of cultures and groups depends upon closure and without it cannot be conceived as a stable feature of human life' – Michael Walzer Spheres of Justice (1983)
")
4
Theoretical Framework & Data Does local diversity increase or reduce white hostility to immigration? Two measures: Desire to reduce immigration and support for the populist right Data, pooled dataset of four Citizenship Surveys 2007-08, 2008-09, 2009-10, 2010-11 The Citizenship Survey has asked the question: “Do you think the number of immigrants coming to Britain nowadays should be increased a lot, increased a little, remain the same as it is, reduced a little, or reduced a lot?”

5
Minorities and Immigration “Battle lines are being drawn between the Roma …and the locals – predominantly Pakistani families”

6
Not just white British…. Source: Home Office/DCLG Citizenship Surveys, 2007-11 (Cumulative)
")
7
Not just white British…

8
Not just working class….

9
Immigration slider

10
Size matters At the individual level: the unemployed/social housing tenants or routine or semi-routine workers, no more or less likely to be opposed to immigration. Respondents who belonged to the lower supervisory/technical groups and identified as English were more likely to want to reduce immigration Respondents living in more deprived areas, no more or less likely to want to reduce immigration Ward-level diversity a positive effect whilst LA diversity negative Population churn as important as inter-ethnic friendships in lowering desire to reduce immigration.

11
Desire to reduce immigration by Local Authority & highest quartile of % white population (selected in black) Desire to reduce immigration by Local Authority & highest quartile of % minority change (selected in black)
 Desire to reduce immigration by Local Authority & highest quartile of % minority change (selected in black)")
12
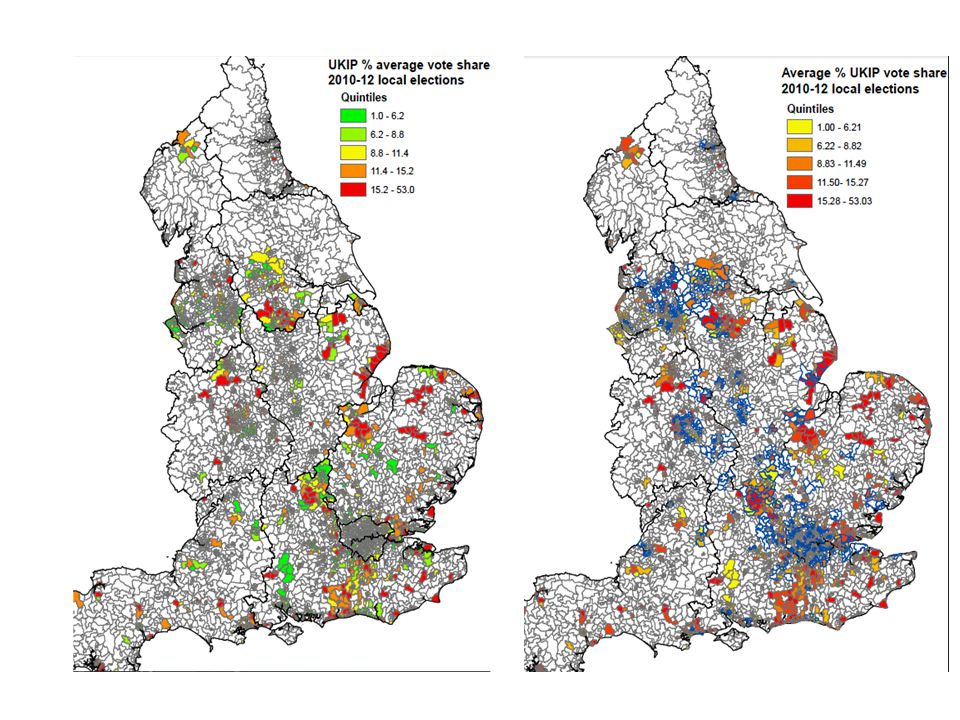
Support for the populist right Do people vote for the far right (BNP) or populist right (UKIP) as a response to demographic change in their local area? As with immigration, dual relationship to support for the far right and diversity: negative at ward level, positive at local authority level. Demographic profile of UKIP and BNP voters broadly similar but geography?

15
Selection bias? Reduce the number of immigrants (a lot and a little) by social class and ward diversity (aggregated dataset) for all white respondents
 by social class and ward diversity (aggregated dataset) for all white respondents.")
16
White Flight?

17
White BritishNet Migration to London from Rest of England and Wales InOutNet% Change 1971-19813,0307,495-4,465-14.7% 1981-19913,7247,208-3,484-11.0% 1991-20013,5667,402-3,836-11.0% 2001-112,9536,962-4,009-13.4% White British WB Working/ Middle Class WB Professional WB with Children WB Twenties 1971-1981-14.7%-14.0%-11.2%-21.9%-2.1% 1981-1991-11.0%-12.0%-10.0%-13.1%11.7% 1991-2001-11.0%-12.7%-6.4%-15.1%27.7% 2001-11-13.4%-15.3%-12.4%-19.6%24.0% Minority Minority Working/ Middle Class Minority Professional Minority with Children Minority Twenties 1971-19811.0%2.1%1.9%0.7%9.6% 1981-19912.7%2.3%3.1%3.3%11.0% 1991-2001-1.9%-1.5%-1.3%-3.6%2.3% 2001-11-4.1% -3.8%-6.9%0.5% Net Migration from London by Ethnicity: with rest of England & Wales, 1971-2011

18
How did Ethnic Groups Move?: by Ethnic Neighbourhood Type, 2001-11 Source: R. Johnston, M. Poulsen, J. Forrest, Multiethnic residential areas in a multiethnic country? A decade of major change in England and Wales,’ Environment and Planning A 2013, volume 45, pages 753 – 759

19
Changes in Mutual Segregation (index of dissimilarity), for Combinations of Groups, 1991-2001 and 2001-2011 Change in Segregation (ID), 1991-2011, England and Wales White British-Minority little change White British-individual minorities modest decline Minority-minority largest decline
, for Combinations of Groups, and Change in Segregation (ID), , England and Wales White British-Minority little change White British-individual minorities modest decline Minority-minority largest decline")
20
Source: Catney, G. 2013. ‘Has neighbourhood ethnic segregation decreased,’ Dynamics of Diversity: Evidence from the 2011 census (JRF/Manchester: February), ethnicity.ac.uk
, ethnicity.ac.uk.")
21
Quintiles (ONS LS 2011) Diverse fifth of Wards Homogeneous four- fifths of Wards 201140.7% Minority4.9% Minority 200127.8% Minority2.4% Minority 199119.8% Minority1.5% Minority White British net outflow Minority net outflow
 Diverse fifth of Wards Homogeneous four- fifths of Wards % Minority4.9% Minority % Minority2.4% Minority % Minority1.5% Minority White British net outflow Minority net outflow")
22
file:///C:/1-Data/1-1-work/1-Research/1-1-Projects/1-white%2 0flight/Models/UK/Ridgway/dependent%20children/5dplot_fr omtxt_quick%20start.swffile:///C:/1-Data/1-1-work/1-Research/1-1-Projects/1-white%2 0flight/Models/UK/Ridgway/dependent%20children/5dplot_fr omtxt_quick%20start.swf [Class; Dependent Children v 20s; Mixed Ethnicity House; English; Tenure] http://www.smartcensus.org.uk/index.php?option=com_wrapp er&view=wrapper&Itemid=611http://www.smartcensus.org.uk/index.php?option=com_wrapp er&view=wrapper&Itemid=611 [time permitting, to show deprivation-density-diversity link] Smart Census Data Plotter
![file:///C:/1-Data/1-1-work/1-Research/1-1-Projects/1-white%2 0flight/Models/UK/Ridgway/dependent%20children/5dplot_fr omtxt_quick%20start.swffile:///C:/1-Data/1-1-work/1-Research/1-1-Projects/1-white%2 0flight/Models/UK/Ridgway/dependent%20children/5dplot_fr omtxt_quick%20start.swf [Class; Dependent Children v 20s; Mixed Ethnicity House; English; Tenure] option=com_wrapp er&view=wrapper&Itemid=611http:// option=com_wrapp er&view=wrapper&Itemid=611 [time permitting, to show deprivation-density-diversity link] Smart Census Data Plotter](http://images.slideplayer.com/9/2500243/slides/slide_22.jpg "file:///C:/1-Data/1-1-work/1-Research/1-1-Projects/1-white%2 0flight/Models/UK/Ridgway/dependent%20children/5dplot_fr omtxt_quick%20start.swffile:///C:/1-Data/1-1-work/1-Research/1-1-Projects/1-white%2 0flight/Models/UK/Ridgway/dependent%20children/5dplot_fr omtxt_quick%20start.swf [Class; Dependent Children v 20s; Mixed Ethnicity House; English; Tenure] option=com_wrapp er&view=wrapper&Itemid=611http:// option=com_wrapp er&view=wrapper&Itemid=611 [time permitting, to show deprivation-density-diversity link] Smart Census Data Plotter")
23
Manchester 1991-2001 London 1991-2001

25
USA 1970-2000 Source: data from Card Mas & Rothstein 2008 Source: Andersson Hammarstedt Neuman 2012

26
Simpson (2007) Method Wards % White Quintile 1755498 Quintile 272687 Quintile 328873 Quintile 418057 Quintile 510234 Total885091 Diversity Seekers White Flight/Avoiders
 Method Wards % White Quintile Quintile Quintile Quintile Quintile Total Diversity Seekers White Flight/Avoiders")
27
Want to Move from White Minority Area (Quintiles 4 & 5) AllNonwhiteWhiteWhite Working Minority Working 47.3%45.5%49.5%59.7%38.2% N37728051840466222 Want to Move from 98% White Area (Quintile 1) AllNonwhiteWhiteWhite Working Minority Working 32.4%46.4%32.4%37.7%50% N671514914967013458144 BHPS & Understanding Society: Attitudes of Movers. Mover Intentions. Source: British Household Panel Survey & UKHLS 1991-2012

28
Moved Out of Ward in 2000-2001: WardsWh BritishMinoritiesWH OtherWhite Irish 98% White75541.1%4.7%3.2%1.5% 87% White7265.4%6.4%7.7%4.1% 73% White2886.8%6.0%8.1%5.6% 57% White1807.0%4.6%7.8%3.8% 33% White1026.1%2.9%13.1%3.2% Total8850 Source: Office for National Statistics. 2001. ONS Longitudinal Study.

29
What Items are on the Menu? Option A Deprived Urban Diverse Rental Stock London Option B Low Deprivation Rural Homogeneous White British Homeowner Stock Non-London Option C? Deprived Urban Homogeneous White British Rental Stock London Option D? Low Deprivation Rural Diverse Homeowner Stock Non-London

30
Which is the more important slice? B A

31
Net Migration from Diverse Wards (quintile 1) by Ethnicity, 1991-2011 White British Interward MoversNet Migration to Diverse Wards as Share of White British Mover Population: In White Ward '01In Diverse Ward '01Total Inter-Ward Movers '01 Move to Whiter Ward '01-11 14330 Move to Same Diversity Ward '01-11 67065730374368 Move to More Diverse Ward '01-11 9180 76,24521,63397,878 12.0%66.2%-54.2% Minority Interward Movers 2001-2011 Net Migration to Diverse Wards as Share of Minority Mover Population: In White Ward '01In Diverse Ward '01Total Inter-Ward Movers '01 Move to Whiter Ward '01-11 1,889 Move to Same Diversity Ward '01-11 1,5276,2067,733 Move to More Diverse Ward '01-11 1,017 2,5448,09510,639 40.0%23.3%16.6% White British Inter-Ward MoversNet Migration to Diverse Wards as Share of White British Mover Population % Change InOutNet 1991-200110,16514,858-4,693 -4.4% 2001-119,18014,330-5,150 -5.3% Minority Inter-Ward MoversNet Migration to Diverse Wards as Share of Minority Mover Population % Change InOutNet 1991-20016891,104-415 -5.8% 2001-111,0171,889-872 -8.2%
 by Ethnicity, White British Interward MoversNet Migration to Diverse Wards as Share of White British Mover Population: In White Ward 01In Diverse Ward 01Total Inter-Ward Movers 01 Move to Whiter Ward Move to Same Diversity Ward Move to More Diverse Ward ,24521,63397, %66.2%-54.2% Minority Interward Movers Net Migration to Diverse Wards as Share of Minority Mover Population: In White Ward 01In Diverse Ward 01Total Inter-Ward Movers 01 Move to Whiter Ward ,889 Move to Same Diversity Ward ,5276,2067,733 Move to More Diverse Ward ,017 2,5448,09510, %23.3%16.6% White British Inter-Ward MoversNet Migration to Diverse Wards as Share of White British Mover Population % Change InOutNet ,16514,858-4, % ,18014,330-5, % Minority Inter-Ward MoversNet Migration to Diverse Wards as Share of Minority Mover Population % Change InOutNet , % ,0171, %")
32
- 66% -23% 66% out, 12% into diversity: Net ‘Segregation’ 23% out, 40% into diversity: Net ‘Integration’ White British Minorities - 12% - 40%

33
Toward v Away from Diversity – Statistical Models Ethnicity matters: Groups move from themselves except white British; white British move from diversity, others to diversity Higher education/occupation move to diverse wards rather than away*, young, students as well. White British leave diversity when: in more diverse ward, with children, working/middle class more than Professionals; Toward diversity: in mixed-ethnicity house, renter, 20s. English v. British/Celtic not significant (no white flight?) Minorities leave diversity when: in mixed-race house, English; toward diversity: in whiter ward.
 Minorities leave diversity when: in mixed-race house, English; toward diversity: in whiter ward..")
34
Into or out of London – Statistical Models English, UK-born predicts move out White in mixed ethnic house, degree, young, foreign-born: predicts stayer. Inner London Higher education/occupation, foreign-born predicts move to London from elsewhere in UK

35
White Flight?: Yougov-ESRC-BBK Survey, August 2013 Moved To Whiter Ward past 10 yrs Moved To More Diverse Ward past 10 yrsSample Not White British53%47%47 White British62%38%239 Total60%40%286

36
Comfort with spouse of different race among ward movers, White British only (Yougov/ESRC survey) To WhiterTo Diverse Sample very comfortable61%39%83 fairly comfortable67%33%33 neither comfortable n57%43%46 fairly uncomfortable64%36%11 very uncomfortable76%24%25 don't know58%42%24 Total63%37%222
 To WhiterTo Diverse Sample very comfortable61%39%83 fairly comfortable67%33%33 neither comfortable n57%43%46 fairly uncomfortable64%36%11 very uncomfortable76%24%25 don t know58%42%24 Total63%37%222")
39
Conclusion Minorities integrate, white British segregate? White British prefer 90+% white areas, except in their 20s Not ‘white flight’: white cultural attraction based on life stage subculture rather than anxiety over boundaries Anti-immigration, political or racist attitudes not strongly linked to moving to whiter area, esp when compared to stayers No selection bias

40
….. Local conditions matter for national issue perceptions and vice-versa Upper working/lower middle class are somewhat more likely to be both ‘white flighters’ and white nationalists White attitudes to immigration may be softened by contact in locale; Or may be hardened by diversity in metro and/or by jumps in minority presence in formerly lily- white areas

41
Potential Policy Implications Immigration: not principally about white working class Housing: retain white British population (social housing, housebuilding, benefits) Housing: aim for dispersed building, slow demographic change. Not to disperse minorities to homogeneous areas Schooling: yes to mixed catchment, but sensitivity to white tipping

Similar presentations


 pantry survey found that.>")


 Conference on Community, Migration and Ethnicity.>")


>")


