Download presentation
Presentation is loading. Please wait.

1
Ayr, 4 November 2011 The economic case against the cuts

2
A crisis of growth and jobs; not a crisis of the public finances

3
Scottish labour market Since December 2007: ILO unemployment increased by 90,000 to 212,000 Claimant count more than doubled to 145,000 Underemployment 190,500 18-24 JSA up by 116% Long-term u/e (all ages) up by 189% Women u/e increasing rapidly: 20% in yr to Sept ‘11 Claimants to FT vacancy ratio of 10:1 across Scotland
 up by 189% Women u/e increasing rapidly: 20% in yr to Sept ‘11 Claimants to FT vacancy ratio of 10:1 across Scotland")
4
Scotland’s Full-time employment deficit Those who want to work in full time jobs but currently; Unemployed 152, 570 Under-employed 184,118 Economically inactive but wanting to work 131,613 = 468,301 or 17.25%

5
Ayrshire Labour market

6
Total JSA Claimants Dec 2007Sept 2011 % increase East Ayrshire2,3564,384 86.1 North Ayrshire2,9905,374 79.7 South Ayrshire1,7132,840 65.8 Scotland69,165140,010 102.4 UK790,3701,578,609 99.7

7
JSA over 6 months Dec 2007Sept 2011 % increase East Ayrshire7601,845 142.8 North Ayrshire9252,265 144.9 South Ayrshire4251,045 145.9 Scotland18,96554,980 189.9 UK238,310608,120 155.12

8
JSA 18-24 yr olds Dec 2007Sept 2011 % increase East Ayrshire7251,380 90.3 North Ayrshire8601,625 88.9 South Ayrshire490895 82.7 Scotland19,24541,625 116.3 UK235,210485,655 106.5

9
JSA 18-24 yrs, over 6 months Dec 2007Sept 2011 % increase East Ayrshire90385 327.8 North Ayrshire115470 308.7 South Ayrshire45235 422.2 Scotland2,37011,065 366.9 UK32,190121,490 277.4

10
Claimants to vacancy ratios Total claimants Total notified vacancies standard full-time vacancies No. of claimants per vacancy No. of claimants per full- time vacancy East Ayrshire4,786303150 15.831.9 North Ayrshire5,933307154 19.338.5 South Ayrshire2,998392144 7.620.8 Column Total148,70223,59715,071 6.39.9

11
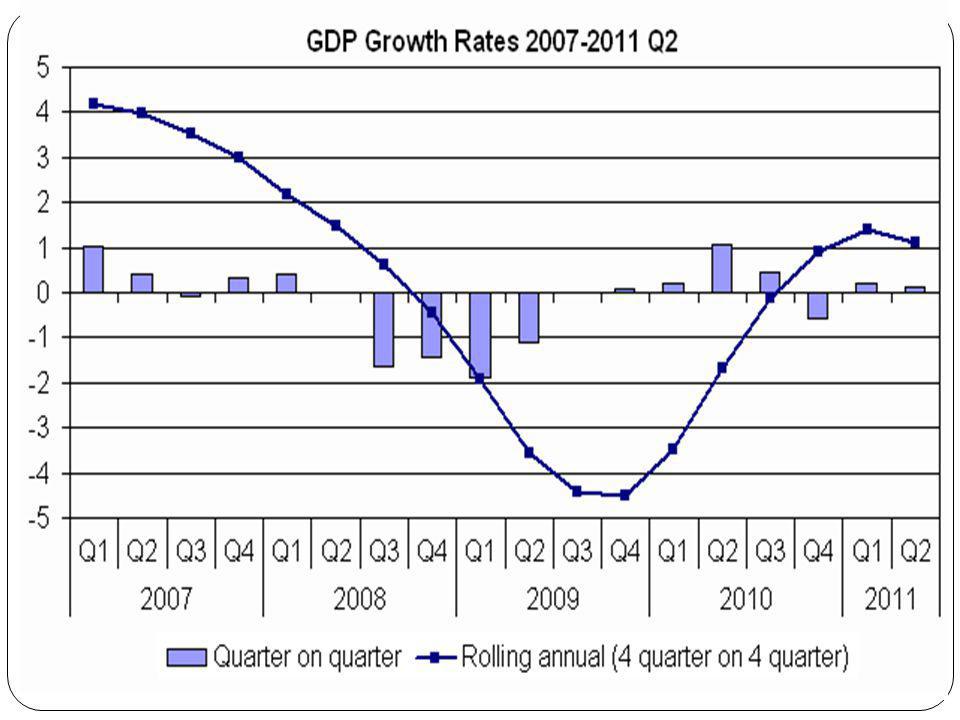
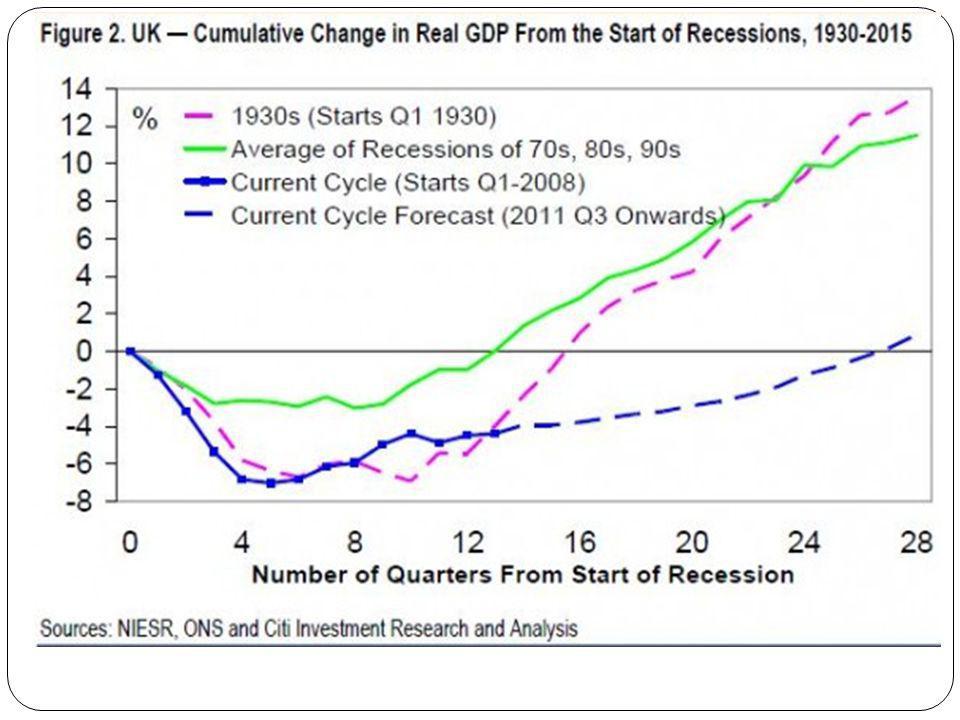
Economic Growth?

14
About to get worse?

15
Total public sector employment in Scotland, 1999 – Q2 2011, headcount

16
Annual change in public sector employment (Q2 2010 – Q2 2011)
")
17
GfK Index of Consumer Confidence October 2011

18
Economic case against the cuts Is rapid and deep austerity really unavoidable? Is the UK in fiscal crisis?

19
The truth about the public finances The current deficit and rising net debt are problems; but not problem is so great that it cant be exaggerated and distorted The current deficit and rising net debt are problems; but not problem is so great that it cant be exaggerated and distorted Investors have enthusiastically funded UK debt at low cost throughout the crisis Investors have enthusiastically funded UK debt at low cost throughout the crisis Gilt auctions consistently oversubscribed Gilt auctions consistently oversubscribed Ministers & media have raised the prospect of an imminent debt crisis whilst failing to describe what is actually happening in the markets Ministers & media have raised the prospect of an imminent debt crisis whilst failing to describe what is actually happening in the markets Investors consider a wide range of factors such as stock of debt, maturity of debt, structure of debt and future economic prospects as well as current deficit Investors consider a wide range of factors such as stock of debt, maturity of debt, structure of debt and future economic prospects as well as current deficit

20
5 reasons why the UK was not, and is not, in danger of becoming the next Greece (or Ireland, or Portugal or Spain)
")
21
1. The UK is not in the Euro The UK has its own currency and the additional economic levers it provides: Currency devaluation Monetary policy (interest rates) The UK can make its own decisions without consulting EU, ECB, IMF and France
 The UK can make its own decisions without consulting EU, ECB, IMF and France.")
22
2The UK deficit is high by international standards; stock of debt is not

23
General Government Debt (% of GDP) 2007200920102014 UK44.168.781.798.3 United States 61.984.893.6108.2 Japan187.7218.8227.0245.6 Italy103.5115.8120.1128.5 France63.878.085.496.3 Germany63.478.784.589.3 Advanced G20 economies 78.298.9106.7118.4
 UK United States Japan Italy France Germany Advanced G20 economies")
24
Key issues (2)
")
25
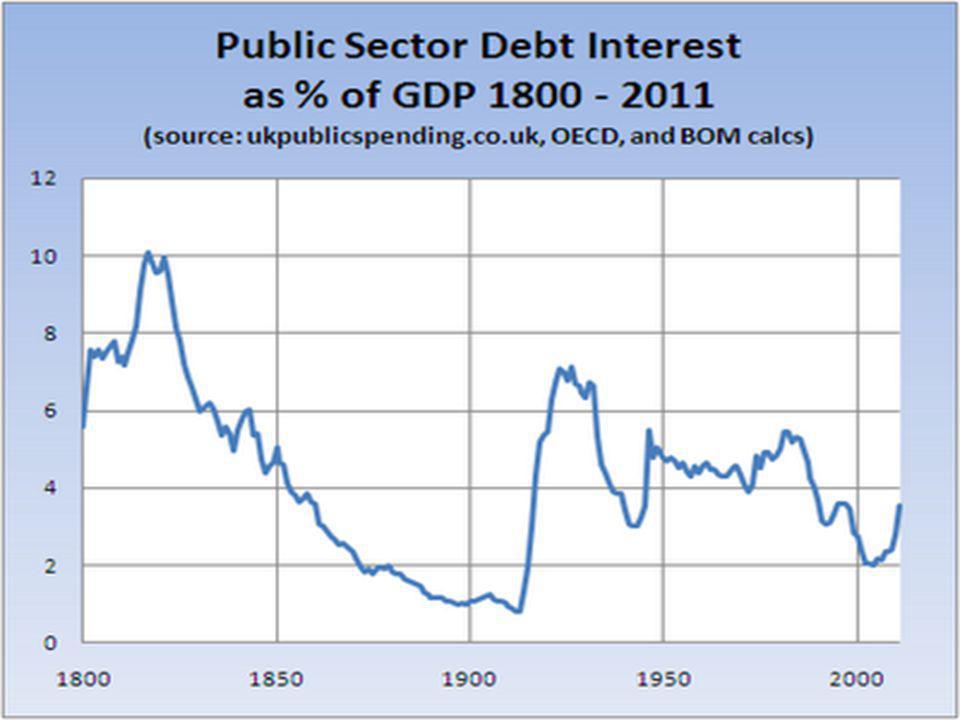
3The cost of servicing UK debt is low; much lower than in Greece and other nations judged to be at risk of default

26
Debt interest payments - £400m a day! Debt interest payments will rise from 1.6% of GDP in 2007 to 3.1% in 2014 Greece is currently spending 12% Average for G20 advanced nations in 2014: 3.5% US in 2014: 4.5% Average debt interest payments for 75 years between 1916-1991: over 3%

28
4The structure of UK debt is different: it is much longer term and the majority is held within the UK; not by external investors

30
5UK economy is bigger, less corrupt and more diverse and dynamic than the Greek economy

31
People generally pay their taxes in the UK; taxes are routinely avoided in Greece Investors trust UK economic Budget data; Greek Budget data is constantly being revised World Bank rates the UK 4 th best country in the world in which to do business (not necessarily a good thing!) – Greece rated 109 th
 – Greece rated 109 th")
32
The market’s price signals – the great hypocrisy “Markets have also been remarkably relaxed about funding these deficits: interest rates on index-linked gilts have been 1 per cent, or less, for more than a year; the yield on 10-year gilts has remained below pre-crisis levels and is now close to 3 per cent; and spreads over German bunds have been 1 percentage point, or less, throughout the crisis”. Martin Wolf, Chief Economics Commentator, Financial Times 16 September 2010

33
Cuts are not good for growth! The evidence does not support the proposition that contractionary fiscal policy (i.e. spending cuts) is expansionary – the confidence fairy is in hiding! The UK in 2011 is not Canada in the 1990s The UK is uniquely poorly placed to take advantage of growth in emerging markets – currently export two and half time more goods and services to Ireland than we sell to China
 is expansionary – the confidence fairy is in hiding. The UK in 2011 is not Canada in the 1990s The UK is uniquely poorly placed to take advantage of growth in emerging markets – currently export two and half time more goods and services to Ireland than we sell to China.")
34
Cuts are not good for growth – the growing evidence base Coalition inherited a recovery growing in strength but growth has since flatlined Growth forecasts revised down by OBR and BoE Unemployment rising across UK Real wages falling Real household income falling Consumer confidence collapsing VAT rise receipts likely to pay for lower than expected growth; will not contribute to paying down debt …and all before the cuts really start…

35
Learn the lessons of economic history 1When unemployment is high, there is a risk of deflation and interest rates are already close to zero…deficit/stimulus spending is required to boost growth and get people back to work. 2Stimulus should be implemented quickly, be short in duration and targeted on a) getting people back to work and b) expanding the economy’s long term capacity to grow sustainably.
 getting people back to work and b) expanding the economy’s long term capacity to grow sustainably..")
36
There is a Better Way Consolidation of public finances (spending cuts and tax rises) should be contingent on growth History suggests that period of sustained growth is the most effective way out the UK’s fiscal position Consolidation when it comes must be as ‘fair and progressive’ as possible: more balanced towards tax rises for individuals and firms who can afford it More important is action to support a shift to a fairer, more sustainable economic and social model: fixing finance, supporting manufacturing & rebuilding the economy’s equalising institutions
 should be contingent on growth History suggests that period of sustained growth is the most effective way out the UK’s fiscal position Consolidation when it comes must be as ‘fair and progressive’ as possible: more balanced towards tax rises for individuals and firms who can afford it More important is action to support a shift to a fairer, more sustainable economic and social model: fixing finance, supporting manufacturing & rebuilding the economy’s equalising institutions")
37
There is a Better Way campaign website/facebook/twitter Tempestuous Seasons blog sboyd@stuc.org.uk @stephenboydSTUC

Similar presentations