Download presentation
Presentation is loading. Please wait.

1
Presented to TIAY AGM May 3, 2013 In collaboration with: Advanced Analytics – Dr. Rick Pollack Arizona State University - Dr. Tim Tyrell McDowell Group - Alaska Box 2180 Marsh Lake, Yukon 867.660-4600

2
Why we did the study Who responded to the survey What are the results – Some Key Findings Draft 2012 Key Yukon Findings - Summer 2012

3
Primary Goal: To develop a sustainable system to monitor visitors behaviour and volumes Objectives: 1.Conduct a survey of visitors exploring options to reduce survey costs while having the ability to compile representative and accurate findings. 2.Create a volume estimation tool that can be used with minimum costs. Draft 2012 Key Yukon Findings - Summer 2012

4
Random/Representative Sample Traditional Sample Contest Paper Inquirers Industry Normal weighting : Exit/Entrance Point and Mode of Transportation weights Requires Normal weighting : (Exit/Entrance Point and Mode of Transportation) PLUS Activity Indicators weights, sample source, and country of origin. Requires Normal weighting : (Exit/Entrance Point and Mode of Transportation) PLUS Activity Indicators weights, sample source, and country of origin. Convenience Tablets Least Accurate Most Accurate Convenience Sample Merging low cost and representative sample Draft 2012 Key Yukon Findings - Summer 2012
 PLUS Activity Indicators weights, sample source, and country of origin. Convenience Tablets Least Accurate Most Accurate Convenience Sample Merging low cost and representative sample Draft 2012 Key Yukon Findings - Summer")
5
Traditional Exit Study Interviews Convenience Study Interviews

6
Margin of Error on Total = +/- 1.57 Data Collection for travel months June 1 to Sept. 30, 2012 Margin of Error on Total = +/- 1.57 Data Collection for travel months June 1 to Sept. 30, 2012 Total Final Sample – Summer Main survey = 3,844 Draft 2012 Key Yukon Findings - Summer 2012

7
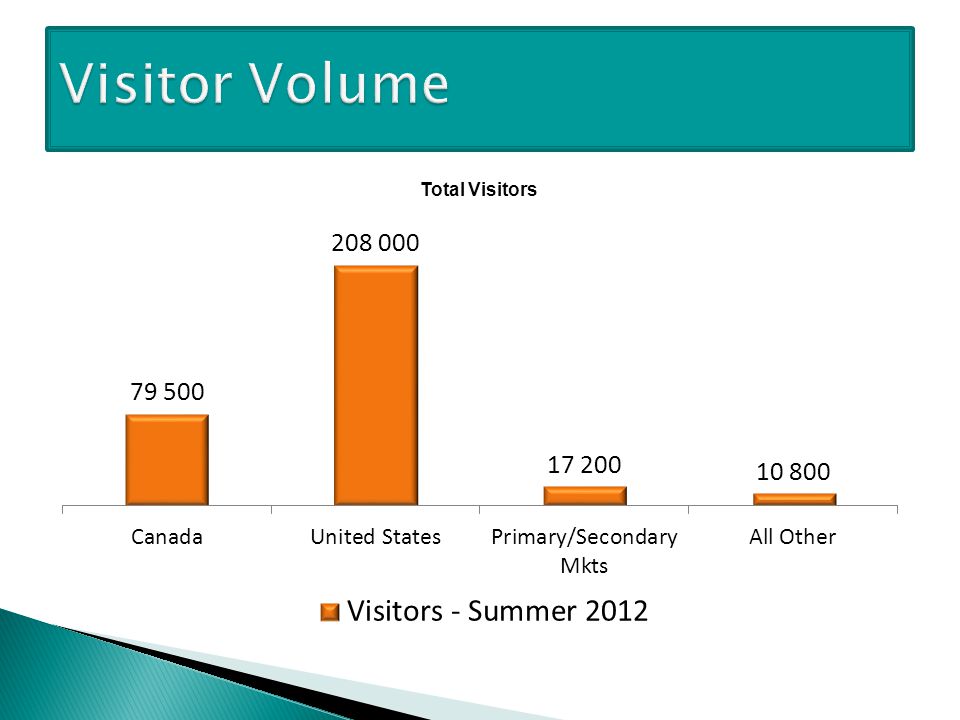
The tourism pie got bigger! (63,390 more visitors than in 2004) +25% +21% +26% Draft 2012 Key Yukon Findings - Summer 2012
 +25% +21% +26% Draft 2012 Key Yukon Findings - Summer")
8
Time Period between StudiesVisitor Change Between 1987 to 19941% per year Between 1994-19993% per year Between 1999-20042% per year Between 2004 - 20123% per year Draft 2012 Key Yukon Findings - Summer 2012

12
2004 = 7% Business Draft 2012 Key Yukon Findings - Summer 2012

14
2004 = 6% VFR, 6% Wilderness Draft 2012 Key Yukon Findings - Summer 2012

15
2004 = 40% Hotel, 24% RV/commercial campground, 13% gov’t cg, 4% Friends/Family 2004 = 40% Hotel, 24% RV/commercial campground, 13% gov’t cg, 4% Friends/Family Draft 2012 Key Yukon Findings - Summer 2012

16
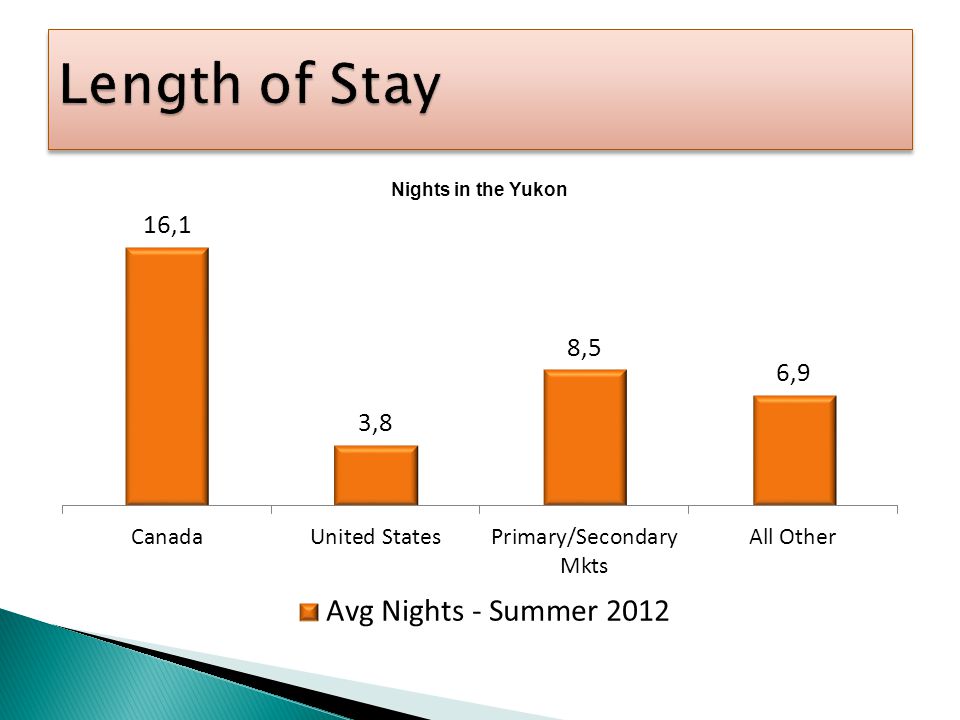
2004 – used nights rather than days… 2004 - 24% day trips vs. 16% in 2012 (but 10% in 1999) - 30% 1 – 2 Nights (24% in 2012) - 34% 3 – 7 nights (35% in 2012) - 12% 8+ nights (25% in 2012) Overall drop in day trip and 1 – 2 night trips, increase in 8+ night trips 2004 – used nights rather than days… 2004 - 24% day trips vs. 16% in 2012 (but 10% in 1999) - 30% 1 – 2 Nights (24% in 2012) - 34% 3 – 7 nights (35% in 2012) - 12% 8+ nights (25% in 2012) Overall drop in day trip and 1 – 2 night trips, increase in 8+ night trips Avg in 2004 = 5.5 nights
 - 30% 1 – 2 Nights (24% in 2012) - 34% 3 – 7 nights (35% in 2012) - 12% 8+ nights (25% in 2012) Overall drop in day trip and 1 – 2 night trips, increase in 8+ night trips 2004 – used nights rather than days… % day trips vs. 16% in 2012 (but 10% in 1999) - 30% 1 – 2 Nights (24% in 2012) - 34% 3 – 7 nights (35% in 2012) - 12% 8+ nights (25% in 2012) Overall drop in day trip and 1 – 2 night trips, increase in 8+ night trips Avg in 2004 = 5.5 nights.")
19
2004 – average = 2.3 person Draft 2012 Key Yukon Findings - Summer 2012

20
2004 = Natural attractions = 58%, Shopping = 64%, Man-made attractions = 58% 2004 = Natural attractions = 58%, Shopping = 64%, Man-made attractions = 58% Draft 2012 Key Yukon Findings - Summer 2012

22
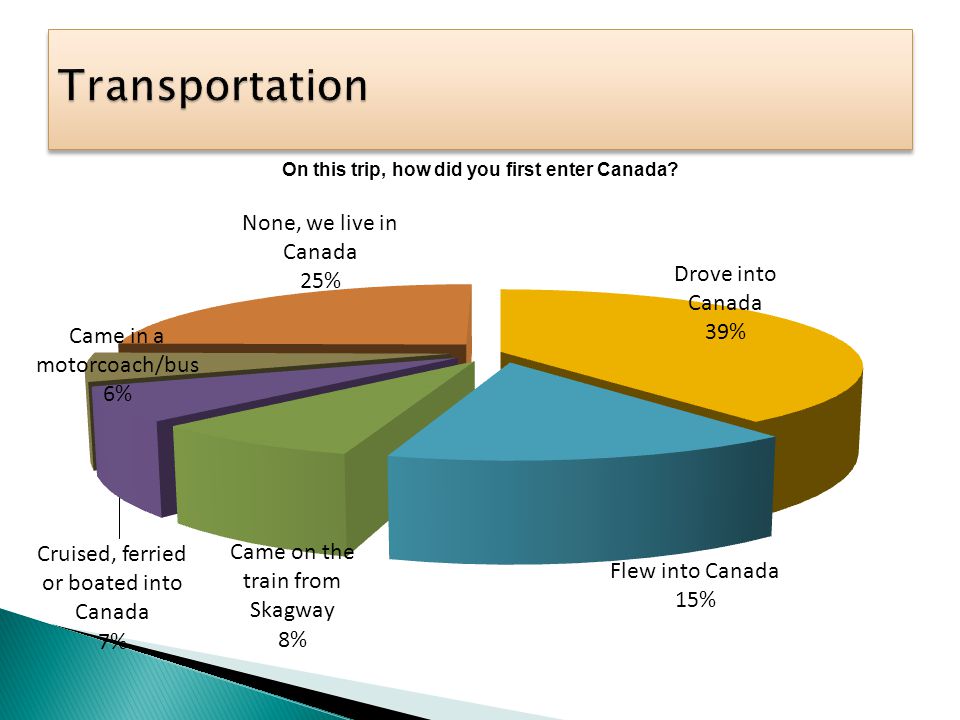
2004 – 70% Car/Truck/Van/Motorcycle, 30% RV/Camper Draft 2012 Key Yukon Findings - Summer 2012

27
2004 Exit Study data reported $75.8 M total spend. That is $87.2M adjusted for inflation. Based on the inflation adjustment for 2004, spending is up $25.8M compared to 2004. A 29% increase A rough comparison on $ per person per day spending suggests a drop from 2004. NOTE: spending questions in 2012 were more detailed and more likely to increase recall of spending. Survey was also post-trip, after all bills and total expenses could be recalled. Draft 2012 Key Yukon Findings - Summer 2012

28
All Yukon related activities, including Pre-Trip Purchases of Hotels, Guided Tour or Activity, Yukon Rental Car or RV plus In Yukon purchases exclude all pre-trip spending, but include spending in the Yukon on Accommodations, Rental Vehicles, Groceries, Alcohol, Meals, Souvenirs/Arts and Crafts, Outdoor Activities, Organized Day tours, Admissions, Entertainment, Gasoline/fuel, Vehicle repair, Local Transportation, Other, plus pre-trip spending on non-cruise (airline) packages and shore excursions. $64 Per Person Per Day $64 Per Person Per Day $112,440,000 Total Spend Most similar to past studies and best fit for Yukon spend Draft 2012 Key Yukon Findings - Summer 2012

29
$10 Per Person Per Day $10 Per Person Per Day Spending Group$ per person per day Total Spend Pre-Trip Spending$10$ 15,460,000 Packages excluding transportation $10$ 18,210,000 In-Yukon Spend$44$ 78,770,000 - Sum of Yukon total$64$112, 440,000 Transportation$14$ 28,110,000 TOTAL w/Transportation$78$140,550,000 Pre-trip = purchases of hotels, guided tours or activities, Yukon rental car/RV/ In Yukon purchases exclude all pre-trip spending, but include spending in the Yukon on Accommodations, Rental Vehicles, Groceries, Alcohol, Meals, Souvenirs/Arts and Crafts, Outdoor Activities, Organized Day tours, Admissions, Entertainment, Gasoline/fuel, Vehicle repair, Local Transportation, Other Packages = pre-trip spending on non-cruise (airline) packages and shore excursions. Transportation = cruise, airline tickets, non-Yukon vehicle rentals Pre-trip = purchases of hotels, guided tours or activities, Yukon rental car/RV/ In Yukon purchases exclude all pre-trip spending, but include spending in the Yukon on Accommodations, Rental Vehicles, Groceries, Alcohol, Meals, Souvenirs/Arts and Crafts, Outdoor Activities, Organized Day tours, Admissions, Entertainment, Gasoline/fuel, Vehicle repair, Local Transportation, Other Packages = pre-trip spending on non-cruise (airline) packages and shore excursions. Transportation = cruise, airline tickets, non-Yukon vehicle rentals
 packages and shore excursions. Transportation = cruise, airline tickets, non-Yukon vehicle rentals.")
30
Draft 2012 Key Yukon Findings - Summer 2012

32
Demographics 2004 = female 47%, 53% male Draft 2012 Key Yukon Findings - Summer 2012

33
Avg. = 52.6 years Median = 52 Avg. = 52.6 years Median = 52 Draft 2012 Key Yukon Findings - Summer 2012

35
2004 – No = 65%, Yes = 35% Draft 2012 Key Yukon Findings - Summer 2012

40
2004 – yes = 61% Draft 2012 Key Yukon Findings - Summer 2012

48
Mean/Avg. = 6.5 months

51
What we have learned so far… ◦ Visitor Volume is up 25% ◦ Visitor Spending is up 29% ◦ Highlights : Increases experienced in: Length of stay Visitors Arriving by Air Party Size Canadian visitors (and Overseas) Decreases experienced in: Spending per person per day Strong satisfaction rating Strong interest in visiting again and referring the destination Draft 2012 Key Yukon Findings - Summer 2012
 Decreases experienced in: Spending per person per day Strong satisfaction rating Strong interest in visiting again and referring the destination Draft 2012 Key Yukon Findings - Summer 2012")
52
Continued cross check with 2004 data Compilation of Map/Pathway data Preparation of Main Summer Report (summary and detailed) Distribution of Summer Reports on Origin/ markets, Mode of Transportation, Key Activities, EQ Segments, Pathways, Trip Purpose and planning,etc. Collection, weighting, analysis and reporting of Winter Survey Draft 2012 Key Yukon Findings - Summer 2012

53
THANKS TO: Air North Westmark Hotels High Country Inn (Coast High Country) Gold Rush Hotel North of Ordinary Many other tourism operators too numerous to mention! Draft 2012 Key Yukon Findings - Summer 2012

Similar presentations


 pantry survey found that.>")


 Grants Chapter 6.>")


