Download presentation
Presentation is loading. Please wait.

1
Introduction to Global and Local Models FORECASTING

2
This presentation uses materials jointly developed by the Integrative Studies 1 teaching team

3
WHY IS FORECASTING USEFUL? Businesses need to plan for the future. This is true for all types of business. Requires some idea about what the future will be.

4
How do you do it? Method 1: ROULETTE Assume that the future will be the outcome of a pure chance process, and so is inherently unpredictable. So don’t forecast just guess and hope.

5
Method 2: OSTRICH Assume that the future will be identical to the present (nothing changes). Method 3: TRENDY The past contains patterns (trends) that will continue into the future. Future values are formed by identifying trends and projecting them forwards.
 that will continue into the future. Future values are formed by identifying trends and projecting them forwards..")
6
Method 4: MAD SCIENTIST Find a theoretical cause and effect model: use knowable changes in causes to predict changes in effects. Method 5: KALEIDOSCOPE Develop a set of scenarios that are plausible stories about the future, knowing all that you do right now. Keep all of these in mind. Evaluate your possible options against each of these.

7
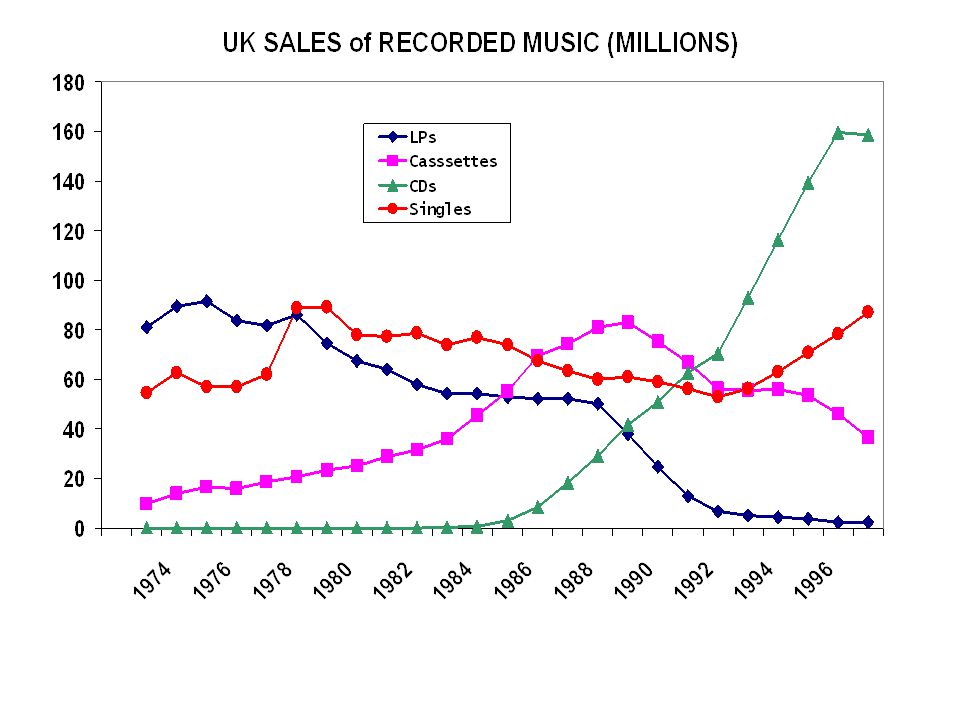
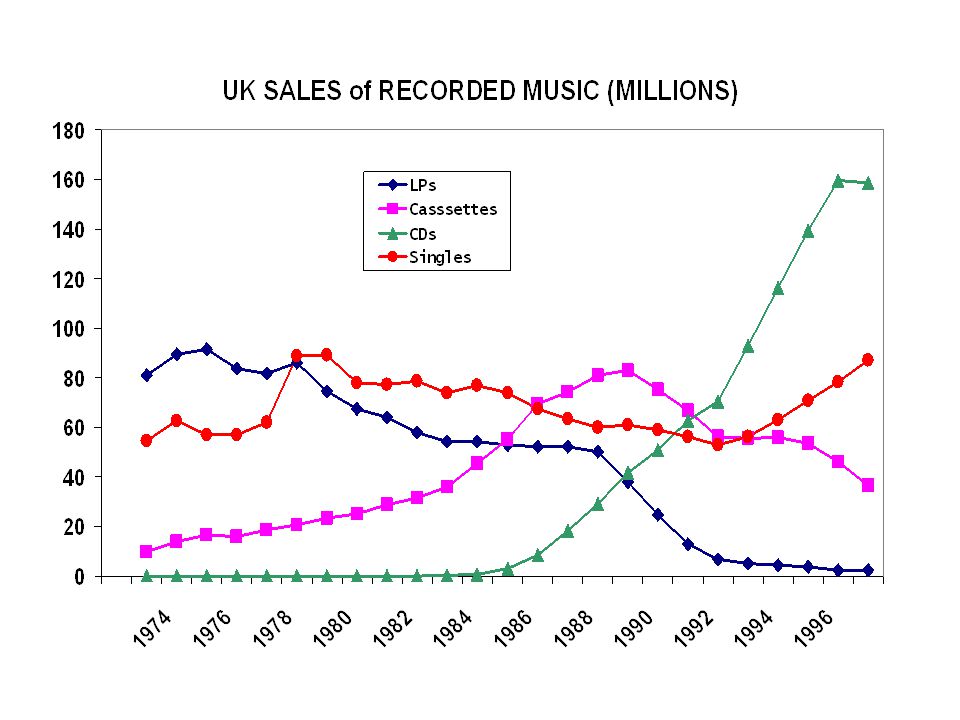
Forecasting involves combining Statistics and our personal knowledge of the background of the data/problem Global Models use all the data Local Models use only a part of the data, often most recent

10
Best Fitting LINEAR Trend

11
Polynomial of Degree 2 Best Fitting

12
Polynomial of Degree 3 Best Fitting

13
Best Polynomial of Degree 3

14
Forecasts to Year 2010 using Best Polynomial of Degree 3

15
Good Fit to Past Data But Unbelievable Forecasts SALES are between 50 and 90 Millions for the Past 30 Years Five Year Forecast is about 150 Millions, and Ten Year Forecast exceeds 300 Millions

16
A polynomial of high degree will usually fit past data well and forecast future very badly In practice, NEVER forecast using Polynomial Trends of Degree higher than 1. Degree 1 is LINEAR TREND

17
Best Global LINEAR Trend

18
Y = 0.0095 * X + 49.4 (Millions) Increasing X by 1 increases Y by 0.0095 X is YEAR, Y is SALES in Millions, and so Each Year, SALES increase by 0.0095 Millions, i.e. 9,500

20
Consider last Six Years only (Local Model)
")
21
Best Local LINEAR TREND

22
Over last 5 Years SALES GREW by 7.0 Million per Year

23
Global Linear Trend implies increases of 9,500 per year Local Linear Trend implies increases of 7 Million per year Statistics OK in Both Cases So, WHICH do we BELIEVE?

24
Y = 7.0 * X + 36.6 (Millions) 1998: X = 8 and Forecast = 7*8 + 36.6 = 92.6 Forecast = 7*18 + 36.6 = 162.6 2008: X = 18 and
 1998: X = 8 and Forecast = 7* = 92.6 Forecast = 7* = : X = 18 and")
25
Best Local Exponential Trend

26
Y = 42.2 e 0.1 X Interpretation? Increasing X by 1 increases Y by approx 0.1 of itself i.e. approx 10% of itself Implies Sales are increasing by 10% per Year (over last 5)
.")
27
SALES growing by 10% per year over last 5 years

28
Y = 42.2 e (Millions) 1998: X = 8 and Forecast = 42.2 e = 93.9 Forecast = 42.2 e = 255.4 2008: X = 18 and 0.1 X 0.1*8 0.1*18
 1998: X = 8 and Forecast = 42.2 e = 93.9 Forecast = 42.2 e = : X = 18 and 0.1 X 0.1*8 0.1*18")
29
LINEAR and EXPONENTIAL TREND FORECASTS to 2010

30
Both LINEAR and EXPONENTIAL Trends seem OK for short-term Forecasts here but Poor for long-term. No surprise: both LOCAL i.e. chosen to fit most recent bit of past data

34
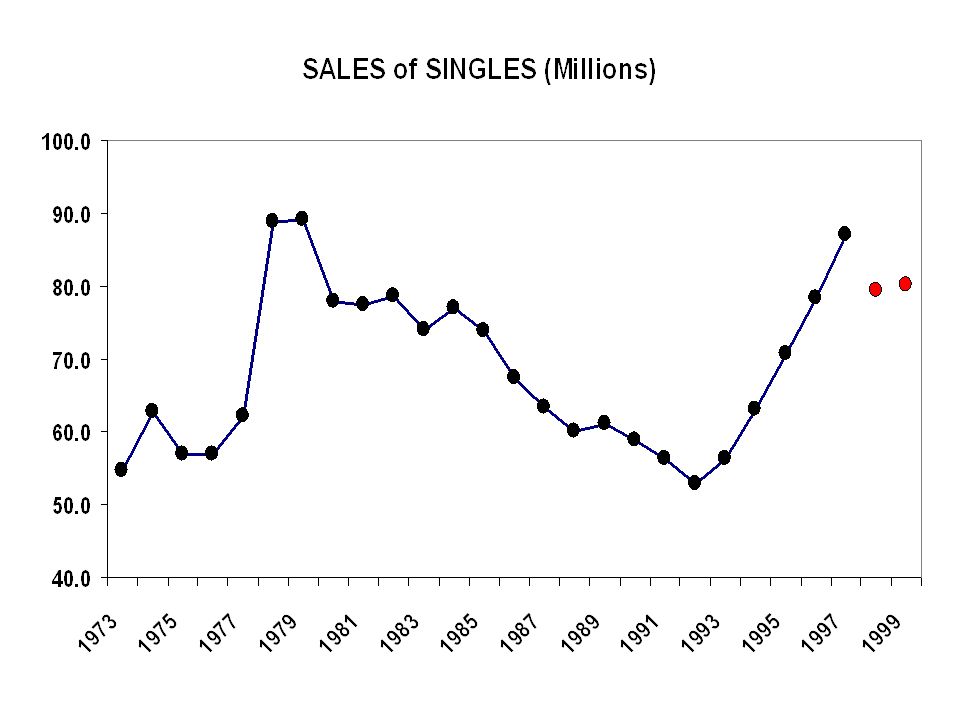
Y = 0.34 * X + 31.5 Single Sales Next Year = 0.34 * CD Sales this Year + 31.5 1997: 158.8 Million CDs sold 1998 Forecast of Single SALES 0.34*158.8 + 31.5 = 85.5 Millions

35
NOTE: Cannot forecast Single Sales further ahead without forecasting CD Sales Can we forecast next year’s Single Sales from last year’s? Scatter Plot of Singles sold each year and previous year

37
Singles: Sales Next Year = 0.8 * Sales this Year + 15.6 1997: Sales = 87 Million Forecast for 1998 is 0.8*87+15.6 = 85.2 Million OK for short-term - What about long-term forecasts?

38
Sales Next Year = 0.8 * Sales this Year + 15.6 Using this equation we can generate forecasts iteratively for any horizon, e.g. Forecast for 1999 = 0.8* Forecast for 1998 + 15.6 0.8*85.2 + 15.6 = 83.8

39
Proceeding in this way: Forecast for 2008 = 78.8 Million Which is much more credible than any of our Trend Forecasts Perhaps it is Pessimistic?

40
SALES NEXT YEAR = 0.8 * SALES THIS YEAR + 15.6 (Millions)
")
41
Compare the Forecasts made

43
Use of a Forecasting method reflects our belief that the future behaviour of the data will be like it was in the past, and will not change over the forecast horizon. This is NOT a Statistical criterion and so cannot be objectively tested. Hence, choice of method requires much care & lots of reasoning as suggested, but also an Act of Faith.

Similar presentations