Download presentation
Presentation is loading. Please wait.

1
Exporting and Importing Graduates Exporting and Importing Graduates by Irene Mosca Robert E. Wright Department of Economics University of Strathclyde March 12, 2010 “ESRC Festival of Social Science “ESRC Festival of Social Science”, Department of Innovation and Skills, Sheffield

2
Introduction One of our objectives is to quantify the nature of graduate labour market flows between the countries and regions of the United Kingdom Why? Regional focus: England, Scotland, Northern Ireland and Wales Export and import of graduates equally interesting as the export and import of goods and services Such information is being fed into the CGE analysis Slide 2/23

3
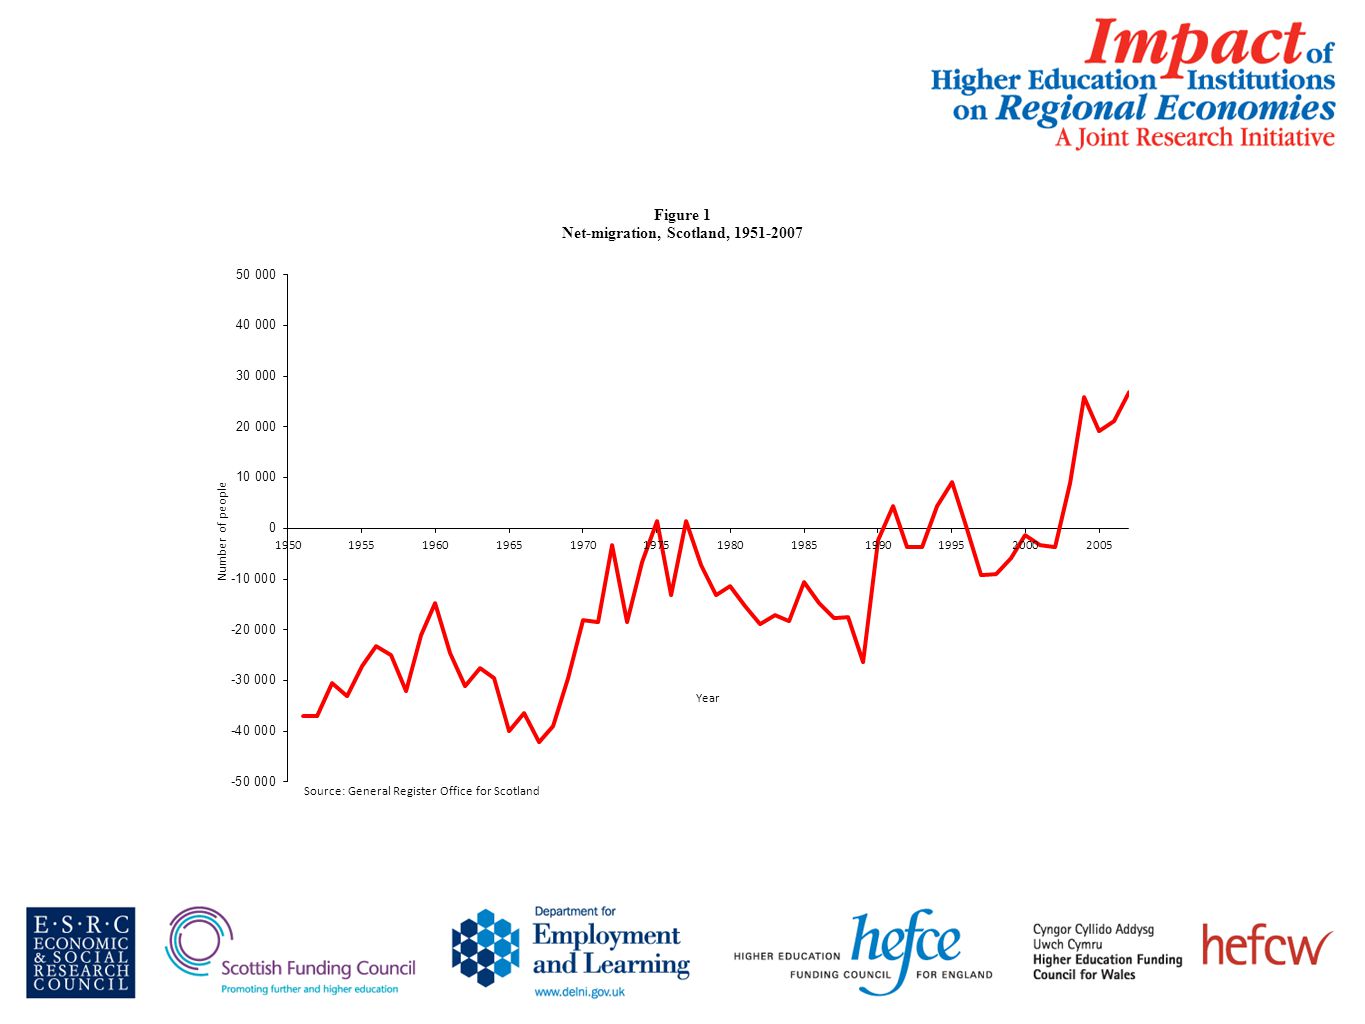
Policy Relevance: Scotland Concern with depopulation of rural and remote regions of Scotland Migration flows of students and graduates thought to “reinforce” migration flows of general population (north and west to the east) “Belief” that building HEIs in rural and remote regions will help reverse these trends Costs versus benefits of “free higher education” “Demographic decline” Who “wins” from regional “trade” in graduates. Over-education, under-employment, skills-mismatch issues Slide 3/23

4
ESRC Grant: “Higher Education, Over-education and Migration”,

7
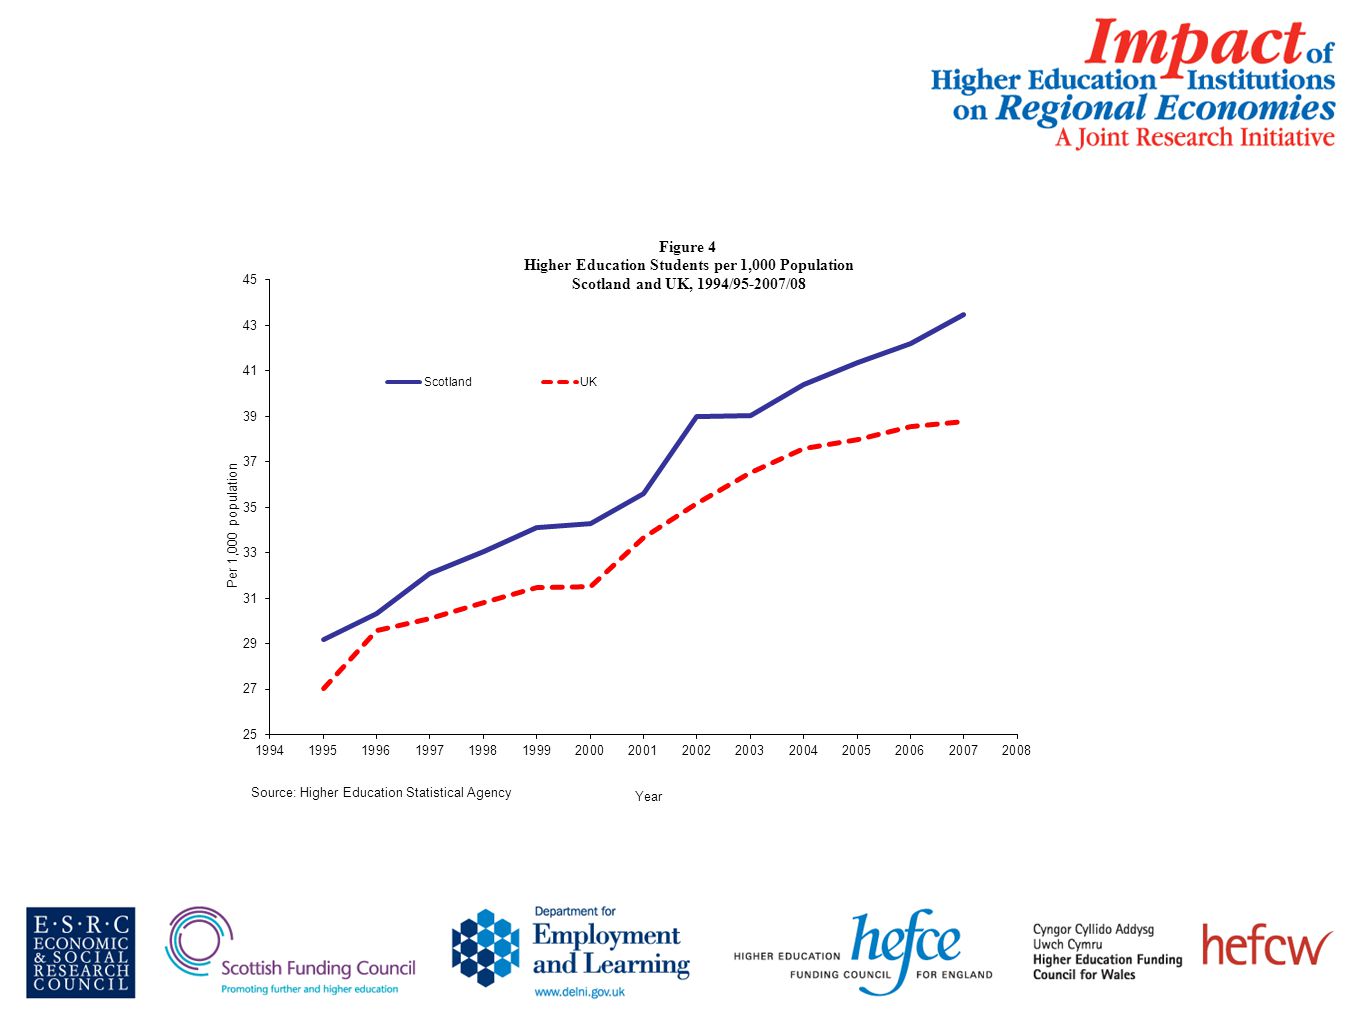
Table 1 Percentage Growth Rates of Various Higher Education Student Groups, 1994/95-2007/08 Type of Student:ScotlandUK Full-time 26.237.5 Part-time 99.668.3 Under-graduates 38.146.5 Post-graduates 51.549.4 Foreign 100.4108.8 Science 55.766.4 Non-science 30.336.2 All students 41.247.1 Source: Higher Education Statistical Agency

8
Table 2 Place of Domicile of Students at British and Scottish and UK Higher Education Institutes, 2007/08 UKScotland Place of domicile: Numbers% % Scotland 175,110 7.6 148,460 70.6 England 1,615,340 70.0 21,755 10.4 Northern Ireland 62,290 2.7 4,800 2.3 Wales 101,970 4.4 675 0.3 Foreign 341,790 14.8 33,895 16.1 UK unknown 9,590 0.4 605 0.3 All 2,306,090100.0210,190100.0 Source: Higher Education Statistical Agency

13
Higher Education Statistical Agency (HESA) is the official agency for the collection, analysis and dissemination of quantitative information about higher education in the UK. Match data from three datasets: (1)Students in Higher Education Institutions (2) Destinations of Leavers from Higher Education Institutions 13 cohorts of graduates: 1994/95 to 2006/2007 (3) Destinations of Leavers From Higher Education Longitudinal Survey 1 cohort of graduates: 2002/03 Data Slide 13/23
Students in Higher Education Institutions (2) Destinations of Leavers from Higher Education Institutions 13 cohorts of graduates: 1994/95 to 2006/2007 (3) Destinations of Leavers From Higher Education Longitudinal Survey 1 cohort of graduates: 2002/03 Data Slide 13/23.")
14
The HESA data provide four key postal addresses: domicile (1)Place of domicile study (2)Place of study employment: 6 months after graduation (3)Place of employment: 6 months after graduation (4)Place of employment: 36 months later This allows us to identify different migration types: “movers versus stayers”
Place of domicile study (2)Place of study employment: 6 months after graduation (3)Place of employment: 6 months after graduation (4)Place of employment: 36 months later This allows us to identify different migration types: movers versus stayers")
15
Table 3 Place of Domicile/Place of Study Matrix Place of Study EnglandScotlandWalesNI Place of Domicile England100% Scotland100% Wales100% NI100%

16
Table 4 Place of Study/Place of Employment-Study Six Months Matrix Place of Employment Six months EnglandScotlandWalesNI Place of Study England 100% Scotland 100% Wales 100% NI 100%

17
Table 5 Place of Domicile/Place of Study Matrix 2002/03-2006/07 Cohorts Place of Study EnglandScotlandWalesNI Place of Domicile England95.8%1.3%2.8%0.1% Scotland8.1%91.5%0.3%0.1% Wales32.1%0.6%67.2%0.1% NI15.7%8.5%0.7%75.1%

18
Table 6 Place of Study/Place of Employment-Study Six Months Matrix 2002/03-2006/07 Cohorts Place of Employment/Study Six months EnglandScotlandWalesNI Place of Study England 97.8%0.7%1.2%0.3% Scotland 12.3%86.2%0.3%1.2% Wales 33.9%0.6%65.2%0.3% NI 6.0%1.2%0.2%92.5%

20
What are the determinants of graduate migration flows? Fit logit regression models where the probability of migrating is related to observable characteristics Analysis at this stage mainly focuses on Scotland Today concerned mainly with Scottish-domiciled students studying in Scotland. Examine migration after graduation to other countries of the UK “Under-graduates graduates” and “post-graduate graduates” considered separately Fit similar models for England, Northern Ireland and Wales for comparative purposes

21
Variables Considered 1) Sex 2) Age at graduation 3) Ethnic group (White or not) 4) Disability (Disabled or not) 5) Studied full or part-time 6) Class of qualification 1st 2-1 2-2 3 rd, Pass, Ordinary, etc
 Sex 2) Age at graduation 3) Ethnic group (White or not) 4) Disability (Disabled or not) 5) Studied full or part-time 6) Class of qualification 1st rd, Pass, Ordinary, etc")
22
5) Subject area 1. Arts and Humanities 2. Social Science 3. Science 4. Social Science-led 5. Science-led 6. Multi-disciplinary 6) Type of HEI 1. College 2. Post-1992 university 3. Non-Russell group pre-1992 university 4. Russell Group university 7) Region of domicile 8) “ HEI mover” (i.e. region of domicile is not region of HEI attended)
 Type of HEI 1. College 2. Post-1992 university 3. Non-Russell group pre-1992 university 4. Russell Group university 7) Region of domicile 8) HEI mover (i.e. region of domicile is not region of HEI attended).")
23
FINDINGS Scottish-domiciled “under-graduates graduates” Probability of migrating to England or Wales or Northern Ireland after graduation is higher for: Male Full-time “Non-white” ethnic background Graduated at age 22-23 (inverted U-shape) Science (or Science-led) qualification or “multi-disciplinary” qualification 1 st Class result (clear gradient) Russell Group university (New Universities/Colleges much lower) Moved to attend HEI Regional effect (higher for Strathclyde region) Decline between 2002-2006
 Science (or Science-led) qualification or multi-disciplinary qualification 1 st Class result (clear gradient) Russell Group university (New Universities/Colleges much lower) Moved to attend HEI Regional effect (higher for Strathclyde region) Decline between")
24
Scottish-domiciled “post-graduate graduates” Probability of migrating to England or Wales or Northern Ireland after graduation is higher for: Male Full-time Non-white ethnic background Disabled Non-white ethnic background Graduated at age 25-26-27 (inverted U-shape) Science (or Science-led) or “multi-disciplinary” qualification Russell Group university and Colleges (New Universities much lower) Moved to go to HEI Regional effects of domicile less pronounced Little change in 2002-2006
 Science (or Science-led) or multi-disciplinary qualification Russell Group university and Colleges (New Universities much lower) Moved to go to HEI Regional effects of domicile less pronounced Little change in")
25
How big are these effects? STEP (1): Create an hypothetical under-graduate graduate with the “average” characteristics of Scottish graduates and use the logit model estimates to “predict” the probability of migrating. GRADUATE “A”
: Create an hypothetical under-graduate graduate with the average characteristics of Scottish graduates and use the logit model estimates to predict the probability of migrating. GRADUATE A .")
26
STEP (2) Create another hypothetical under-graduate graduate with the following characteristics: Male Full-time Not disabled White ethnic background Graduated at age 22 Science qualification 1 st Class result Russell Group university Moved to study and use the logit model estimates to “predict” the probability of migrating. GRADUATE “B”

27
STEP (3) Compare the difference in the predicted probabilities
 Compare the difference in the predicted probabilities")
28
Predicted Probability of Migrating Graduate AGraduate B Scotland6.0%24.1%

29
Predicted Probability of Migrating Graduate AGraduate B Scotland6.0%24.1% England0.9%2.2% Northern Ireland6.2%11.1% Wales8.7%33.9%

30
Relationship between migration and getting a “graduate job”

31
Elias, P. and Purcell, K. (2004) SOC (HE): A Classification of Occupations for Studying the Graduate Labour Market, ESRU Research paper No. 6., University of Warwick SOC2000: 1)Traditional graduate: the established professions, for which, historically, the normal route has been via an undergraduate degree programme( e.g. solicitors and doctors) 2)Modern graduate: the newer professions, particularly in management, IT and creative vocational areas, which graduates have been entering since educational expansion in the 1960s (e.g. computer programmers and journalists).
 SOC (HE): A Classification of Occupations for Studying the Graduate Labour Market, ESRU Research paper No. 6., University of Warwick SOC2000: 1)Traditional graduate: the established professions, for which, historically, the normal route has been via an undergraduate degree programme( e.g. solicitors and doctors) 2)Modern graduate: the newer professions, particularly in management, IT and creative vocational areas, which graduates have been entering since educational expansion in the 1960s (e.g. computer programmers and journalists)..")
32
3) New graduate: areas of employment, many in new or expanding occupations, where the route into the professional area has recently changed such that it is now via an undergraduate degree programme (e.g. physiotherapists and sale managers). 4) Niche graduate: occupations where the majority of incumbents are not graduates, but within which there are stable or growing specialist niches which require higher education skills and knowledge (e.g. nurses and hotel managers) 5) Non graduate: occupations for which a graduate level education is inappropriate (e.g. school secretaries and bar staff)
. 4) Niche graduate: occupations where the majority of incumbents are not graduates, but within which there are stable or growing specialist niches which require higher education skills and knowledge (e.g. nurses and hotel managers) 5) Non graduate: occupations for which a graduate level education is inappropriate (e.g. school secretaries and bar staff).")
33
Table 7 Percentage Employed 2002/3 - 2006/07 Cohorts t ScotlandEnglandNorthern IrelandWales 6 months78.0%77.1%78.5%78.1% In graduate job (of those in employment) 75.0%72.8%74.5%70.5% In graduate job (mover)84.4%77.5%83.1%80.6% In graduate job (stayer)74.2%72.6%73.8%69.2%
 75.0%72.8%74.5%70.5% In graduate job (mover)84.4%77.5%83.1%80.6% In graduate job (stayer)74.2%72.6%73.8%69.2%")
34
2002-2003 Cohort of graduates

35
Table 8 Percentage Employed 2002/3 Cohort t ScotlandEnglandNorthern IrelandWales (a) 6 months76.2%76.1%75.4%79.6% (b) 36 months90.3%89.4%89.9%90.6%
 6 months76.2%76.1%75.4%79.6% (b) 36 months90.3%89.4%89.9%90.6%")
36
Table 9 Percentage Employed in Graduate Jobs 2002/03 Cohort ScotlandEnglandNorthern IrelandWales (a) 6 months69.5%69.4%73.2%72.4% (b) 36 months81.9%80.6%79.9%78.6%
 6 months69.5%69.4%73.2%72.4% (b) 36 months81.9%80.6%79.9%78.6%")
37
Table 10 Percentage Employed in Graduate Jobs – Undergraduate and Postgraduate Graduates 2002/3 Cohort t:6 months36 months UndergradPostgradUndergradPostgrad Scotland62.8%90.0%79.2%91.3% England61.1%91.9%76.7%93.0% Northern Ireland66.4%87.0%75.5%90.5% Wales66.0%87.1%74.6%88.7%

38
Table 11 Percentage Employed in Graduate Jobs Movers versus Stayers 2002/3 Cohort t6 months36 months Mover/StayerMover StayerMoverStayer Scotland84.3%68.3%85.7%81.6% England78.0%69.1%75.9%80.6% Northern Ireland80.5%72.7%87.1%78.5% Wales83.3%71.5%81.7%78.9%

39
Table 12 Percentage Employed in Non-graduate Job after 6 Months Employed in Graduate Job after 36 months ScotlandEnglandNorthern IrelandWales Mover70.1%75.7%76.7%44.2% Stayer59.7%61.1%50.8%56.7%

40
Conclusions?

Similar presentations


 pantry survey found that.>")


