Download presentation
Presentation is loading. Please wait.

1
Chapter 6 The Periodic Table

2
Organizing The Elements
Section 1 Organizing The Elements

3
Learning Targets 6.1.1 – I can explain how elements are organized in a periodic table – I can compare early and modern periodic tables – I can identify three broad classes of elements.

4
Searching for an Organizing Principle
Before the 1700’s only 13 elements were known. During the 1700’s many more were discovered – so how to organize them became the question. Chemists used the properties of elements to sort them into groups.

5
1829 JW Dobereiner (German 1780-1849) published his triad method.
Only problem was some elements wouldn’t fit into a triad.

6
Mendeleev’s Periodic Table
Many attempts were made to organize the elements. 1869 Dmitri Mendeleev (Russian) published his. Lothar Meyer published about the same time. Mendeleev got credit because he was first and could explain the usefulness better.
 published his. Lothar Meyer published about the same time. Mendeleev got credit because he was first and could explain the usefulness better.")
7
Mendeleev arranged the elements in his periodic table in order of atomic mass.
Mendeleev left spaces and predicted elements would be discovered to fill those spaces.

9
The Periodic Law Mendeleev’s table was not perfect.
1913 Henry Moseley (British) fixed/tweaked the periodic table. He put the elements in order of atomic number and it’s been that way since.
 fixed/tweaked the periodic table. He put the elements in order of atomic number and it’s been that way since.")
10
Periodic Law – when the elements are arranged in order of increasing atomic number, there is a periodic repetition of their physical and chemical properties.

11
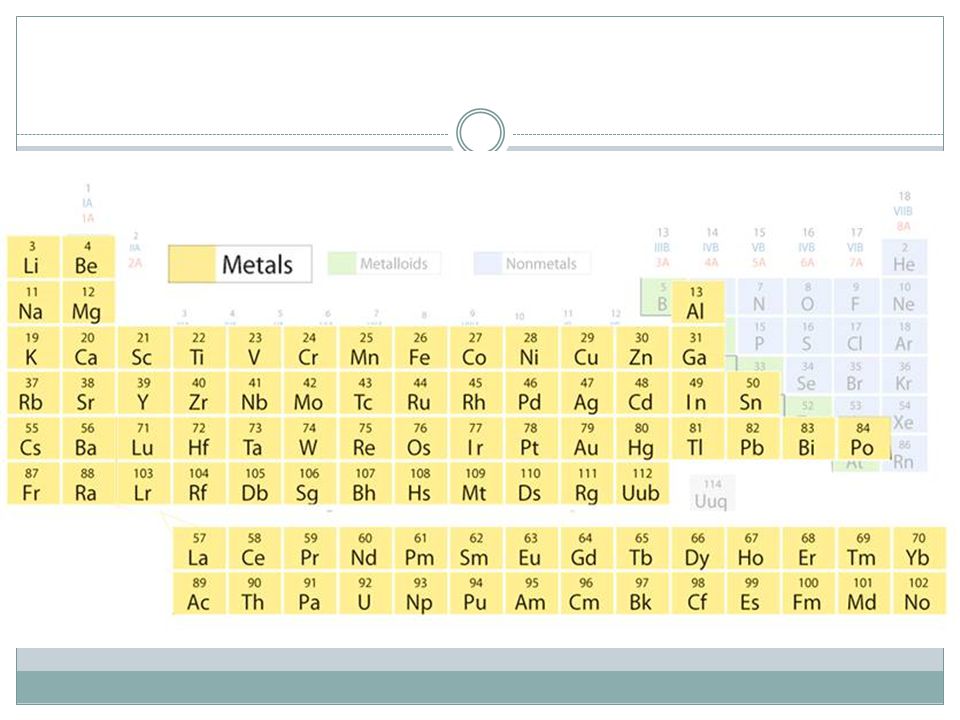
Metals, Nonmetals, Metalloids
IUPAC (International Union of Pure and Applied Chemistry). IUPAC decided labeling groups 1-18 instead of 1A-8A and 1B-8B would end confusion about groups. Three classes of elements are metals, nonmetals, and metalloids.
. IUPAC decided labeling groups 1-18 instead of 1A-8A and 1B-8B would end confusion about groups. Three classes of elements are metals, nonmetals, and metalloids.")
12
Metals About 80% of the elements.
Metal – good conductor of heat and electric current. Luster, ductile (pulled into wires), malleable (pounded into sheets).
, malleable (pounded into sheets).")
14
Nonmetals Basically opposite of metals and they vary among themselves.
Nonmetal – poor conductors of heat and electric current. Brittle (shatter when hit with a hammer).
.")
16
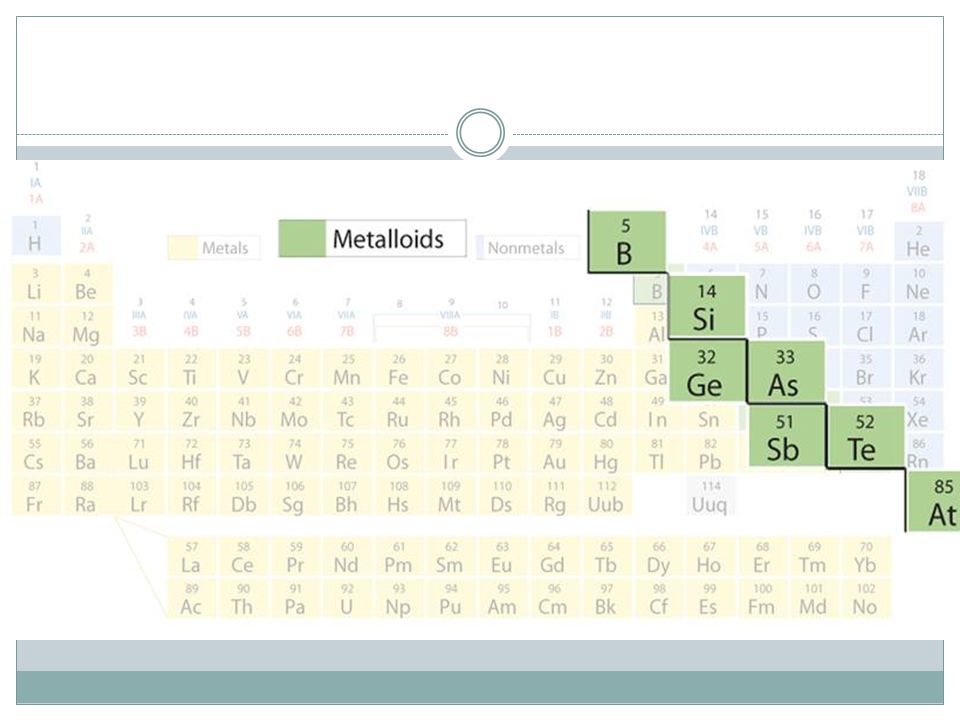
Metalloids Fall along stair step line.
Metalloid (semimetals) – properties similar to metals and nonmetals. Behavior can be changed by changing conditions.
 – properties similar to metals and nonmetals. Behavior can be changed by changing conditions.")
18
Classifying the elements
Section 2 Classifying the elements

19
Learning Targets 6.2.1 – I can describe the information in a periodic table – I can classify elements based on electron configuration – I can distinguish representative elements and transition metals.

20
Squares in the Periodic Table
The periodic table displays the symbol and names of the elements, along with information about the structure of their atoms.

22
Squares in the Periodic Table Contd.
Alkali metals – Group 1A elements Alkaline Earth metals – Group 2A (from Arabic al aqali meaning the ashes. Halogens – Group 7A (from Greek hals meaning salt and Latin genesis meaning to be born).
.")
24
Electron Configurations in Groups
Elements can be sorted into noble gases, representative elements, transition metals or inner-transition metals based on their electron configurations.

25
The Noble Gases Noble Gas – Elements in Group 8A
Sometimes called inert gases because they do not take part in reactions. Look at the highest occupied energy level.

26
The Representative Elements
Representative elements – display a wide range of physical and chemical properties. The s and p sublevels of the highest occupied energy level are not filled.

27
For the representative elements the group number equals the number of electrons in the highest occupied energy level.

28
Transition Elements Transition metal – highest occupied sublevel and a nearby d sublevel contain electrons. Inner-transition metal – highest occupied sublevel and a nearby f sublevel generally contain electrons.

29
Blocks of Elements Look at the electron configuration and placement of the elements. All but helium follow a pattern.

31
Section 3 Periodic Trends

32
Learning Targets 6.3.1 – I can describe trends among the elements for atomic size – I can explain how ions form – I can describe periodic trends for first ionization energy, ionic size, and electronegativity.

33
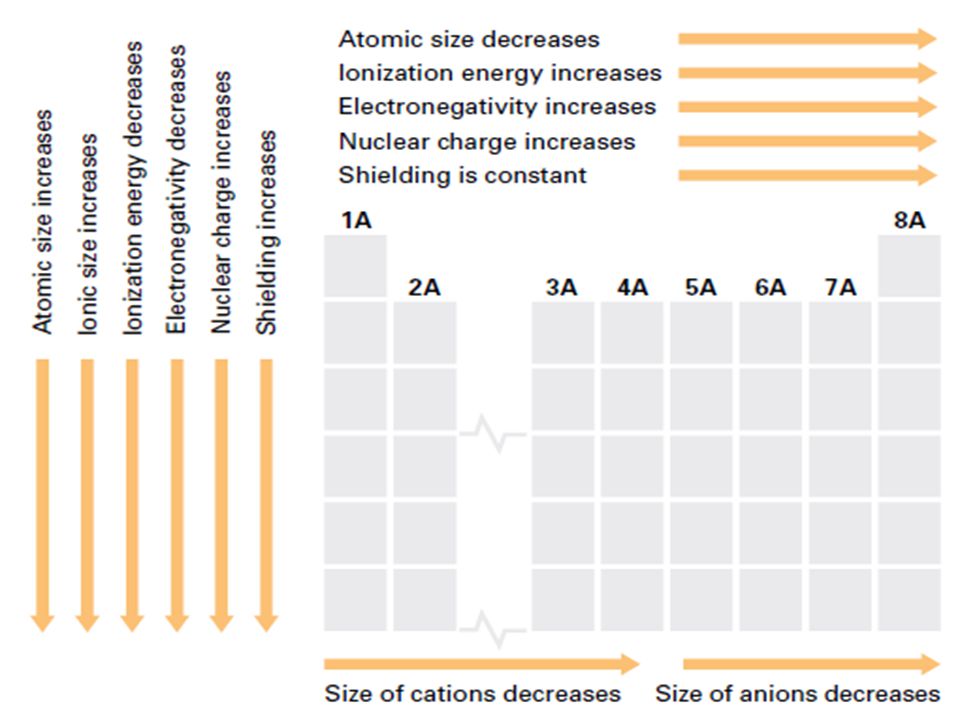
Trends in Atomic Size Atomic radius – one-half the distance between the nuclei of two atoms of the same element when the atoms are joined. In general, atomic size increases from top to bottom within a group and decreases from left to right across a period.

34
Group Trends in Atomic Size
As you go down a group the amount of protons increases but so does the number of electrons in occupied energy levels so the size gets larger.

35
Periodic Trends in Atomic Size
Same thought but there are no more filled sublevels. Here the electrons are in the same sublevel so the charge on the nucleus pulls the electrons closer so the size gets smaller.

38
Ions Ion – an atom or group of atoms that has a positive or negative charge. Positive and negative ions form when electrons are transferred between atoms. Cation – ion with a positive charge. Anion – ion with a negative charge.

40
Trends in Ionization Energy
Ionization energy – energy required to remove an electron from an atom. First ionization energy tends to decrease from top to bottom within a group and increase left to right across a period.

41
Group Trends in Ionization Energy
As the size of the atom increases, nuclear charge, has a smaller effect on the electrons in the highest occupied energy level so the energy required to remove an electron decreases.

42
Periodic Trends in Ionization Energy
The nuclear charge increases but shielding remains constant so it will take more energy to remove the electrons as you go left to right.

46
Trends in Ion Size Cations are always smaller than the atoms from which they form.

47
Trends in Ion Size Anions are always larger than the atoms from which they form.

48
Size generally increases

49
Trends in Electronegativity
Electronegativity – the ability of an atom of an element to attract electrons when the atom is in a compound. In general, electronegativity values decrease from top to bottom within a group. For representative elements the values tend to increase from left to right across a period.

51
Summary of Trends The trends that exist among the properties can be explained by variations in atomic structure. See page 178 for a quick summary (put this in your notes).
.")
Similar presentations


 Had blank spots for undiscovered elements Called periodic.>")
