Download presentation
Presentation is loading. Please wait.

1
Beyond the Red and Green “The Rest of the Story!”

2
Building Environments Where Students Feel Connected, Supported, and Challenged ” “Building Environments Where Students Feel Connected, Supported, and Challenged ”

4
138,000

5
“ALL educators committed to ensuring the learning of ALL students” 100% Proficient by 2014

6
Valid Complaints/ Legitimate Concerns

7
“The Rest of the Story”

8
Would you feel good about your child receiving their education from any teacher at your school? Would a child with all the risk factors for dropping out stand a chance for success at your school?

10
3

11
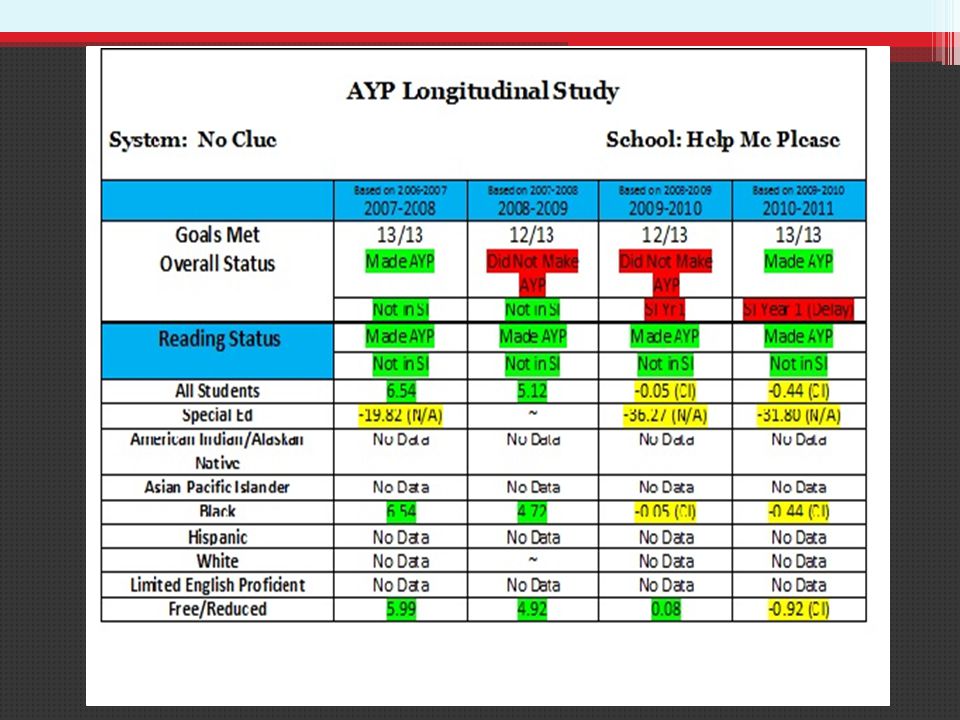
True performance over time

12
1

14
Blank 4 Year Longitudinal Templates www.schoolimprovement.schools.officelive.com

15
“There is Still More to the Story”

16
SchoolSI StatusProficiency – 3 year Junior HighNot in SI44 - 48 - 49 High SchoolNot in SI40 – 50 - 57 High SchoolSI Yr 148 – 51 - 53 Special SchoolSI Yr 532 – 55 - 68 Middle HighNot in SI50 – 51 - 57 Special SchoolSI Yr 266 – 66 - 54 High SchoolNot in SI52 – 55 - 61 High SchoolNot in SI52 – 64 – 55 High SchoolNot in SI60 – 55 – 64 High SchoolNot in SI65 – 59 - 59 High SchoolNot in SI56 – 64 - 64 High SchoolNot in SI62 – 63 - 62 Special SchoolNot in SI53 – 66 - 68 High SchoolNot in SI64 – 62 – 62 High SchoolSI Yr 368 – 46 - 75

17
100% Mastery of the Minimum

18
Grad Exam ReadingMath 50 – 55/84 (approx.) 48 – 53/100 (approx.)
 48 – 53/100 (approx.)")
19
2

20
Looking Good! “I mean no one is doing well in the Special Ed subgroup”

21
Alabama High School Graduation Exam Dallas County - (024) Keith Middle-High School - (0080) Grade: 11 Reading: 2009-2010 GroupPercent Tested (1) Percent of Students in Each Achievement Level (2) Percent in Group (3) Level I & IILevel IIILevel IV All Students (2009-2010) 100.00 37.25 58.82 3.92 100.00 All Students (2008-2009) 98.11 42.31 57.69 0.00 100.00 Sp Ed Students (2009-2010) 100.00 * * * 9.80 Sp Ed Students (2008-2009) 80.00 * * * 7.69 Gen Ed Students (2009-2010) 100.00 30.43 65.22 4.35 90.20 Gen Ed Students (2008-2009) 100.00 39.58 60.42 0.00 92.31 Male (2009-2010) 100.00 44.00 56.00 0.00 49.02 Male (2008-2009) 100.00 47.83 52.17 0.00 44.23 Female (2009-2010) 100.00 30.77 61.54 7.69 50.98 Female (2008-2009) 96.67 37.93 62.07 0.00 55.77 Black (2009-2010) 100.00 37.25 58.82 3.92 100.00 Black (2008-2009) 98.11 42.31 57.69 0.00 100.00 Non-Migrant (2009-2010) 100.00 37.25 58.82 3.92 100.00 Non-Migrant (2008-2009) 98.11 42.31 57.69 0.00 100.00 Non-Limit Eng Prof (09-2010) 100.00 37.25 58.82 3.92 100.00 Non-Limit Eng Prof (08-2009) 98.11 42.31 57.69 0.00 100.00 Free Lunch (2009-2010) 100.00 40.43 57.45 2.13 92.16 Free Lunch (2008-2009) 97.87 43.48 56.52 0.00 88.46 Reduced Lunch (2009-2010) 100.00 * * * 3.92 Reduced Lunch (2008-2009) 100.00 * * * 1.92 Non Poverty (2009-2010) 100.00 * * * 3.92 Non Poverty (2008-2009) 100.00 * * * 9.62 Poverty (2009-2010) 100.00 38.78 57.14 4.08 96.08 Poverty (2008-2009) 97.92 42.55 57.45 0.00 90.38
 Keith Middle-High School - (0080) Grade: 11 Reading: GroupPercent Tested (1) Percent of Students in Each Achievement Level (2) Percent in Group (3) Level I & IILevel IIILevel IV All Students ( ) All Students ( ) Sp Ed Students ( ) * * * 9.80 Sp Ed Students ( ) * * * 7.69 Gen Ed Students ( ) Gen Ed Students ( ) Male ( ) Male ( ) Female ( ) Female ( ) Black ( ) Black ( ) Non-Migrant ( ) Non-Migrant ( ) Non-Limit Eng Prof ( ) Non-Limit Eng Prof ( ) Free Lunch ( ) Free Lunch ( ) Reduced Lunch ( ) * * * 3.92 Reduced Lunch ( ) * * * 1.92 Non Poverty ( ) * * * 3.92 Non Poverty ( ) * * * 9.62 Poverty ( ) Poverty ( )")
22
GradeProficientAMO 8 th Grade56%67% 7 th Grade61%79% 6 th Grade72%85% 5 th Grade75%85% 4 th Grade75%82% 3 rd Grade79%85%

23
Why the difference between the two reports?

24
Grade Where we are… (2009 results) Where we need to be! (2010 AMO) % of difference Grade Level Reading Goal 385% To increase the percent of students scoring proficient (Levels III and IV) by ___% in reading on the ARMT to 85%. 482% To increase the percent of students scoring proficient (Levels III and IV) by ___% in reading on the ARMT to 82%. 585% To increase the percent of students scoring proficient (Levels III and IV) by ___% in reading on the ARMT to 85%. 685% To increase the percent of students scoring proficient (Levels III and IV) by ___% in reading on the ARMT to 85%. 779% To increase the percent of students scoring proficient (Levels III and IV) by ___% in reading on the ARMT to 79%. 867% To increase the percent of students scoring proficient (Levels III and IV) by ___% in reading on the ARMT to 67%. 1189% To increase the percent of students scoring proficient (Levels III and IV) by ___% in reading on the AHSGE to 89%. “Where We Are and Where We Need to Be!” Setting Grade Level Reading Goals for 09-10
 % of difference Grade Level Reading Goal 385% To increase the percent of students scoring proficient (Levels III and IV) by ___% in reading on the ARMT to 85%. 482% To increase the percent of students scoring proficient (Levels III and IV) by ___% in reading on the ARMT to 82%. 585% To increase the percent of students scoring proficient (Levels III and IV) by ___% in reading on the ARMT to 85%. 685% To increase the percent of students scoring proficient (Levels III and IV) by ___% in reading on the ARMT to 85%. 779% To increase the percent of students scoring proficient (Levels III and IV) by ___% in reading on the ARMT to 79%. 867% To increase the percent of students scoring proficient (Levels III and IV) by ___% in reading on the ARMT to 67%. 1189% To increase the percent of students scoring proficient (Levels III and IV) by ___% in reading on the AHSGE to 89%. Where We Are and Where We Need to Be! Setting Grade Level Reading Goals for")
25
Grade Where we are… (2009 results) Where we need to be! (2010 AMO) 8 Sp Ed30% 67% Gen Ed60% Male57% Female56% Black56% Non Migr57% EL56% Free51% Poverty51% “Where We Are and Where We Need to Be!” Setting Grade Level Reading Goals for 09-10
 8 Sp Ed30% 67% Gen Ed60% Male57% Female56% Black56% Non Migr57% EL56% Free51% Poverty51% Where We Are and Where We Need to Be! Setting Grade Level Reading Goals for")
27
Blank - Where You Are, Where You Need to Be templates www.schoolimprovement.schools.officelive.com Disaggregated Reports are located on the SDE website – click on the Accountability Reporting tab

29
3

31
Proficiency Worksheets

32
1AYP Over Time 2Disaggregated Reports 3DRC

34
“When people become resigned to their fate, nothing ever changes.” Rosabeth Moss Kanter

Similar presentations


 Grants Chapter 6.>")

