Download presentation
Presentation is loading. Please wait.

1
10-Year Study Results Colorado Resource Options and Transmission Expansion This slide deck contains results from the 2012 TEPPC Study Program related to the Colorado Resource Option. The results for the associated transmission expansion projects follow immediately along with flow information on impacted WECC paths.

2
Renewable Options Under High Load Cases The Basics Study Concept Starting case: 2022 High Load (PC1-5) –Increase WECC annual energy demand 8% Results in additional 12,000 GWh of RPS resource requirements (per statutes) Model added 12,000 GWh in regions throughout WECC (w/ transmission) Goal Compare different resource and transmission options Total (capital and production) cost comparisons –Will be shown at a later date
 –Increase WECC annual energy demand 8% Results in additional 12,000 GWh of RPS resource requirements (per statutes) Model added 12,000 GWh in regions throughout WECC (w/ transmission) Goal Compare different resource and transmission options Total (capital and production) cost comparisons –Will be shown at a later date")
3
Add: 12,000 GWh to meet WECC RPS Add transmission Renewable Options Under High Load Cases Increase WECC-wide load 8% 1 2 3 For these regions

4
Increase WECC-wide load 8% 1 8% 8% increase to peak and energy 10% 10% decrease to energy Higher Load = Additional RPS Energy

5
Calculate ratios of planned renewables in TEPPC 2022 Common Case Do not include existing resources Do not include DG IRP and LRS data Apply ratio to study build-out of 12,000 GWh Concept: development trends are best representation of what could be added to each state More resources available than what is identified in WREZ More granular information from CPUC/CAISO Locate resources using WREZ peer-analysis tool Extrapolation Method Add 12,000 GWh to meet WECC RPS 2

6
Wind Solar PV Solar Thermal Small Hydro Geothermal Biomass RPS Resource Option Studies Breakdown of Incremental 12,000 GWh

7
Higher load and new resources = 1- Check PRM 2 - Add CTs (if needed)
")
8
PC1-5 High Load PRM Gap 1) Added CTs in 100 MW increments to make up this 11,426 MW PRM Gap 2) CT’s were adjusted in Renewable Options Under High Load studies
 Added CTs in 100 MW increments to make up this 11,426 MW PRM Gap 2) CT’s were adjusted in Renewable Options Under High Load studies")
9
Installed Generation Capacity Generation TypeAZ-NM-NVBasinAlberta British ColumbiaCA-NorthCA-SouthNWUSRMPAWECC Biomass RPS1725332080075750153503,137 Geothermal357850201,4802,4435804,820 Small Hydro RPS3530082759228401,759 Solar PV1,82257003,5173,1661976189,377 Solar CSP05070003701,591002,468 Solar CSP629911000000133541 Wind1,9603,5974,5079693,1195,46012,0533,34435,009 Hydro3,9242,34299818,0467,8861,40130,9021,31366,811 Pumped Storage1460001,2121,41405243,296 Coal9,8759,9235,38501021383,2396,52035,182 Nuclear4,0350002,2402,2461,16009,681 Combined Cycle17,1772,2636,67024012,00713,8047,1543,58662,900 Combustion Turbine4,3771,1464,619664,7597,4287303,62926,755 Other Steam1,47634678179542,9994515626,883 Other177112120305100782471,030 Negative Bus Load243520006114032528 Dispatchable DSM1,1481,2396601,5792,9542853267,597 Total47,37522,07722,65420,15841,11346,29957,26520,833277,775 Additional resources change this number

10
3 fewer CTs needed in Basin This makes sense: 3,000 MW wind × 10% = 300 MW to peak = 3 fewer CTs

11
WY-CO Intertie TransWest Express Zephyr A /B/C/D High Plains Express Path 8 Upgrade MSTI + SWIP N Selkirk – Bell – Ashe Nicola – Chief Joe Selkirk – Ashe DC Selkirk – Buckley DC SSPG East SSPG North SSPG South High Plains Express None Centennial West Transmission Expansion Projects 3 Add transmission

12
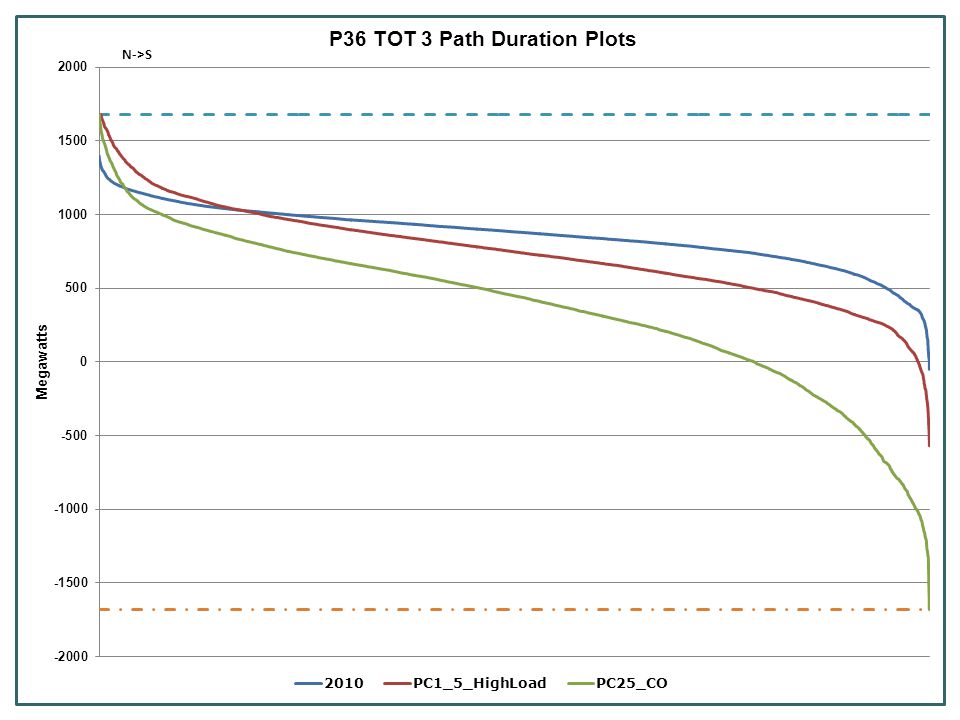
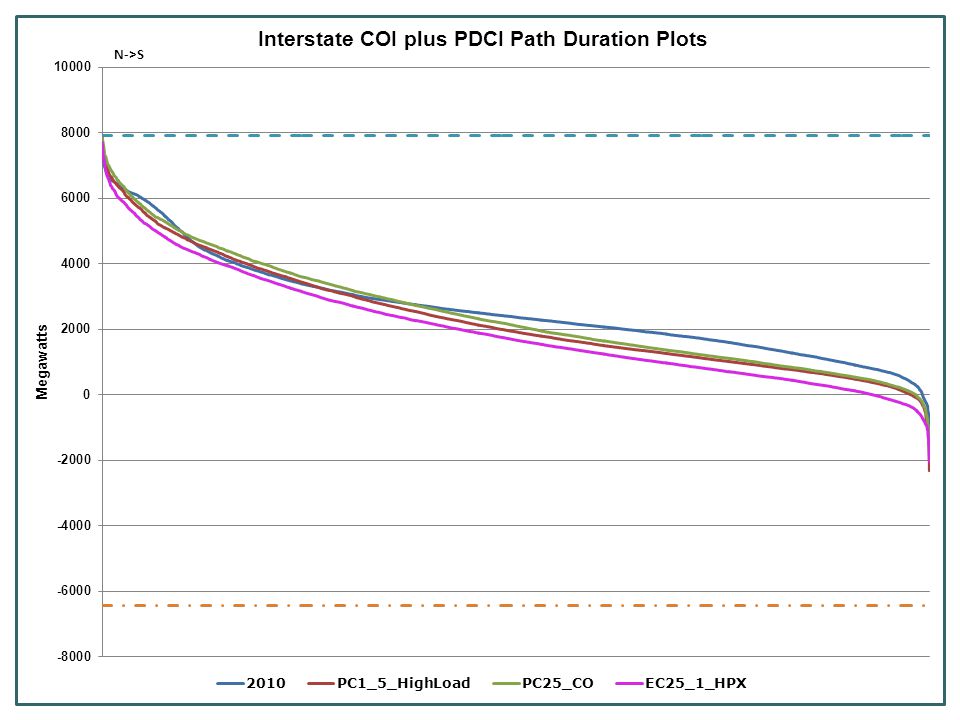
Now to the results… 1)Resource assumption overview 2)Portfolio Case generation results (versus PC1-5 High Load) 3)Transmission projects overview 4)Expansion case generation results (versus PC1-5 High Load and Portfolio Case) 5)Path flow results - Reviewed duration plots for key WECC paths. Will show some that are interesting in this presentation.

13
+ 267 + 93 + 753 + 3786 Colorado Resource Assumptions Wind Solar PV Solar Thermal Small Hydro Geothermal Biomass RPS

14
Production cost decreased $405 M (2.3%) Dump energy increased 37 GWh (11%) Emergency Energy decreased 0% CO2 Emissions decreased 1.4% AZ, NV, CA, CO
 Dump energy increased 37 GWh (11%) Emergency Energy decreased 0% CO2 Emissions decreased 1.4% AZ, NV, CA, CO")
15
What is different? Loads Transmission Resources

19
10-Year Study Results PC25 Colorado Resource Option EC25-1 HPX HPX

20
Production cost decreased $438 M (2.5%) Dump energy increased 25.7 GWh (7.7%) Emergency Energy decreased 0% CO2 Emissions decreased 1.4% AZ, NV, CA, CO
 Dump energy increased 25.7 GWh (7.7%) Emergency Energy decreased 0% CO2 Emissions decreased 1.4% AZ, NV, CA, CO")
21
What is different? Loads Transmission Resources

22
Production cost decreased $33 M (.1%) Dump energy decreased 11.5GWh (3.1%) Emergency Energy decreased 0% CO2 Emissions decreased.1% AZ,CA
 Dump energy decreased 11.5GWh (3.1%) Emergency Energy decreased 0% CO2 Emissions decreased.1% AZ,CA")
23
What is different? Loads Transmission Resources

24
6,000 GWh 8,000 GWh

Similar presentations


 Project.>")


 calculation used to rank competing resources in the RPS.>")