Download presentation
Presentation is loading. Please wait.

1
MN Farming Game

2
MN’s Agricultural Regions Arrowhead Dairy Belt Corn Belt Red River Valley

3
Polk Stearns Martin Renville Fillmore MN Farming Game

4
MN Farms with Livestock

5
Estimated Farms and Size 1984

7
1972-73 MN Farming Game

8
Major MN Crops 1973

9
MN Soybean Acreage 1955-73

10
1973 Farming Headlines 1973 was a record-breaking year! Corn and soybeans both experience record harvests Minnesota’s wheat harvest was largest since 1899! Oat production up 15% Barley harvest up 18% Sunflower harvest up 9% The average MN farmer made $19,337 – a new record

11
1977-78 MN Farming Game

12
Departure from Normal Precipitation 1978

13
Minnesota Crop Yields

14
Major MN Crops 1977-78

15
MN Crop Production Changes 1977-78

16
Corn Production 1978

17
Soybean Production 1978

18
1978 Farm Headlines Farm production costs increase because of rising oil prices (fuel, fertilizer and chemicals) Good growing conditions throughout MN! Record yields for corn! Above normal yields for soybeans & sunflowers Wheat, barley and oat crops down significantly Big news was rapid expansion of sunflowers into MN Many farmers took advantage of Payment-In- Kind (PIK) and reduced acreages Average MN farmer made $15,865!
 and reduced acreages Average MN farmer made $15,865!.")
19
1983-84 MN Farming Game

20
1984 Farm Headlines Farm production costs increase because of spiking oil prices (Iran-Iraq War)
")
22
1984 Farm Headlines Excellent growing conditions throughout MN Soybean crop breaks 1982 production record Corn production 88% higher than 1983 Record-breaking year for small grains Wheat & barley yields beat old records by 7 bushels/acre Barley production exceeds previous record set in 1935 Farm production costs increase because of spiking oil prices (Iran-Iraq War)
")
23
MN Leading Ag Counties 1984

24
Corn Production 1984

25
Soybeans Production 1984

26
Wheat Production 1984

27
Oats Production 1984

28
1984 Farm Headlines Big farm news in 1984 was low prices 1979 Russian grain embargo had created a vast surplus of crops Prices received below those of 1972! Yet farm production costs up 300% from 1973 Farm bankruptcies common 592 MN farmers lost their farms in 1984

29
Farm Bankruptcies 1981-84 Minnesota, North and South Dakota

30
Midwest Farm Bankruptcies 1984 Ohio 208 3.9% North Dakota 131 2.5% South Dakota 244 4.6% Nebraska 429 8.1% Kansas 190 3.5% Missouri 382 8.9% Iowa 1,301 24.6% Minnesota 692 11.2% Wisconsin 294 6.4% Illinois 205 5.6% Indiana 321 8.1% Michigan 85 1.6%

31
1983-84 Farm Journal What crops were most profitable for farmers in your region during this time? What was the main reason so few farmers made money during this period?

32
1987-88 MN Farming Game

33
1988 Farm Headlines

34
Crude Oil Prices 1970-2008

35
1988 Farm Headlines Farm production costs decline with lower oil prices Energy prices down 27% since 1979

36
Departure from Normal Precipitation 1988

37
1988 Farm Headlines MN faces worst drought since 1934! Temps reach 110 o at Brown’s Valley in late June Farm production costs decline with oil prices lower Energy prices down 27% since 1979

39
Corn Yields Minnesota and United States

40
Soybean Yields Minnesota and United States

41
Effects of 1988 MN Drought

42
1988 Farm Headlines Low yields for all crops Corn and soybeans lowest since 1976 Small grains yields lowest since 1966 Oat crop smallest since 1879! Farm production costs decline with oil prices lower Energy prices down 27% since 1979 MN faces worst drought since 1934! Temps reach 110 o at Brown’s Valley in late June

43
Corn Production 1988

44
Soybeans Production 1988

45
Wheat Production 1988

46
Barley Production 1988

47
MN Leading Ag Counties 1988

48
MN Farm Income

49
MN Farm Income/ Government Payments

50
Stability of MN Farm Income Over 4 Decades

51
1988 Farm Headlines Prices up only slightly Government payments (PIK) soar! Average MN farmer made $16,546 in 1988 Farm production costs decline with oil prices lower Energy prices down 27% since 1979 MN faces worst drought since 1934! Temps reach 110 o at Brown’s Valley in late June Low yields for all crops Corn and soybeans lowest since 1976 Small grains yields lowest since 1966 Oat crop smallest since 1879!

52
2007 FUTURES CONTRACT MN Farming Game

53
March 1, 2007 Futures Contract MN County Agricultural Cooperative (MNCAC) offers farmers the opportunity to sell their entire crop at the following prices: Corn: $3.16/bu Soybeans: $6.75/bu Sugar Beets: $47.50/ton Alfalfa Hay: $91.00/ton Barley: $3.06/bu Spring Wheat: $4.79/bu Oats: $2.34/bu
 offers farmers the opportunity to sell their entire crop at the following prices: Corn: $3.16/bu Soybeans: $6.75/bu Sugar Beets: $47.50/ton Alfalfa Hay: $91.00/ton Barley: $3.06/bu Spring Wheat: $4.79/bu Oats: $2.34/bu")
54
2008 FUTURES CONTRACT MN Farming Game

55
March 1, 2008 Futures Contract MN County Agricultural Cooperative (MNCAC) offers farmers the opportunity to sell their entire crop at the following prices: Corn: $4.56/bu Soybeans: $11.30/bu Sugar Beets: $47.20/ton Alfalfa Hay: $130.00/ton Barley: $3.81/bu Spring Wheat: $9.55/bu Oats: $3.18/bu
 offers farmers the opportunity to sell their entire crop at the following prices: Corn: $4.56/bu Soybeans: $11.30/bu Sugar Beets: $47.20/ton Alfalfa Hay: $130.00/ton Barley: $3.81/bu Spring Wheat: $9.55/bu Oats: $3.18/bu")
56
2007-08 MN Farming Game

57
2008 Farm Headlines The drought of 2006-07 ended in August 2007 when heavy rains cause flooding in SE MN

59
Median Net MN Farm Income

60
Crop Production Costs

61
2008 Farm Headlines The drought of 2006-07 ended in August when heavy rains cause flooding in SE MN Farm production costs skyrocket with rapid increases in oil prices Crop prices rise steadily to new records only to have them collapse in July with oil prices and other commodities Farmers who sold on futures contracts made out like bandits

62
MN Farming Game Summary

64
MN Farming Cash Receipts 2005

65
MN Farm Game Conclusions Corn = #1 Soybeans = #2 Hogs makes most $

66
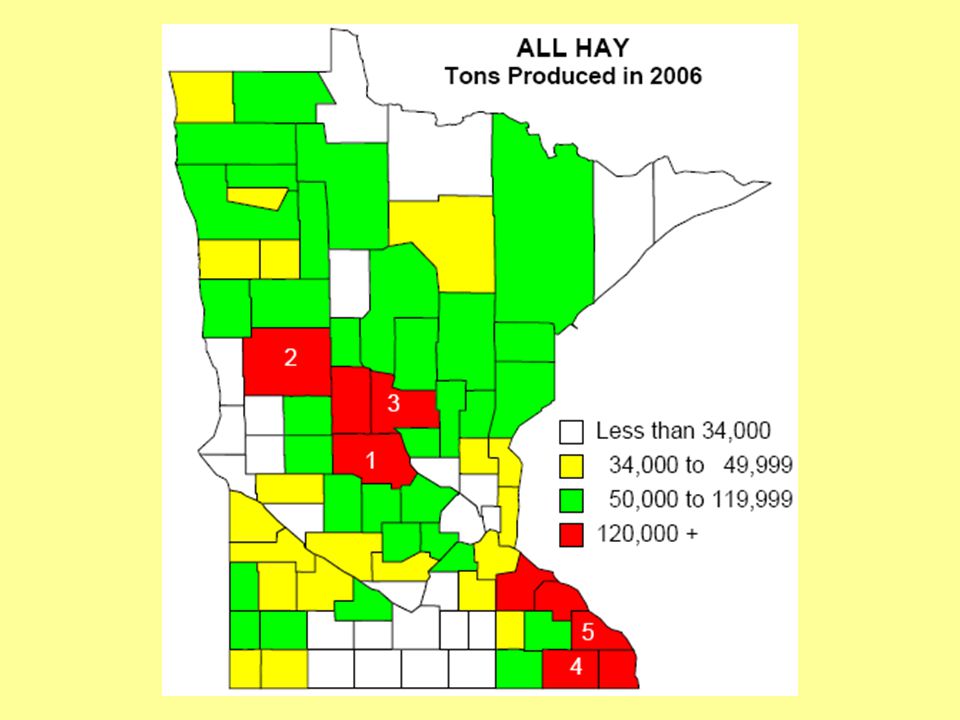
MN Leading Ag Counties 2007 1 st 2 nd 3 rd 4 th 5 th All Crops MartinRenvilleStearns Blue EarthKandiyohi Corn RenvilleMartin FaribaultRedwoodKandiyohi Soybeans Redwood Polk FaribaultNobles Martin Wheat Polk MarshallKittsonNormanClay Oats Otter TailToddRoseau Fillmore Goodhue Barley MarshallRoseau Polk PenningtonKittson Sugar Beets Polk NormanClayMarshallWilkin Hay Stearns Otter TailWinonaMorrisonWabasha

69
Hogs 2002 Number of Hogs

70
MN Farm Game Conclusions Corn, soybeans and hogs concentrated in Corn Belt counties Corn = #1 Soybeans = #2 Hogs makes most $

72
Sugar Beet Production 2002 Total Tons

75
MN Farm Game Conclusions Corn = #1 Soybeans = #2 Hogs makes most $ Corn, soybeans and hogs concentrated in Corn Belt counties Small grains (spring wheat, barley and sunflowers) and sugar beets concentrated in Red River Valley
 and sugar beets concentrated in Red River Valley")
78
Dairy Cattle 2002 Number of Dairy Cows

79
Beef Cattle 2002 Number of Beef Cattle

80
Chickens 2002 Number of Chickens

81
MN Farm Game Conclusions Corn = #1 Soybeans = #2 Hogs makes most $ Corn, soybeans and hogs concentrated in Corn Belt Small grains (spring wheat, barley and sunflowers) and sugar beets concentrated in Red River Valley Hay, oats, dairy and beef cattle, chickens and turkeys concentrated in Dairy Belt
 and sugar beets concentrated in Red River Valley Hay, oats, dairy and beef cattle, chickens and turkeys concentrated in Dairy Belt")
82
MN Farm Game Conclusions Many factors out of the farmer’s control Profit depends on weather and market conditions Good weather does not guarantee success Prices highest when product in short supply Farm income increasingly unpredictable Markets increasingly influenced by world events

83
Average MN Farm Size 1935-2007

84
MN Farm Size 2002

86
MN Farm Game Conclusions Number of farms declining Remaining farms getting larger (1972 = 272 acres, 2007 = 347 acres)
")
87
Farm Population as a Percent of Total Population

88
MN Farm Game Conclusions Number of farms declining Average farm size increasing (1972 = 272 acres, 2007 = 347 acres) Fewer people involved in farming
 Fewer people involved in farming")
90
MN County Population Change 2000-2005

91
MN Farm Game Conclusions Number of farms declining Average farm size increasing (1972 = 272 acres, 2007 = 347 acres) Fewer people involved in farming Population decline occurring in many farming counties
 Fewer people involved in farming Population decline occurring in many farming counties")
94
MN Farm Game Conclusions Number of farms declining Average farm size increasing (1972 = 272 acres, 2007 = 347 acres) Fewer people involved in farming Population decline occurring in many farming counties Many leaving farms for higher paying jobs in the Twin Cities
 Fewer people involved in farming Population decline occurring in many farming counties Many leaving farms for higher paying jobs in the Twin Cities")
95
2007 MN Farmland Values Average Price Market Per Acre: Value:

Similar presentations


 and.>")
