Download presentation
Presentation is loading. Please wait.

1
UB Tech 2014 Through the Looking Glass of Big Data Phil Ice, Ed.D. VP, Research and Development American Public University System

3
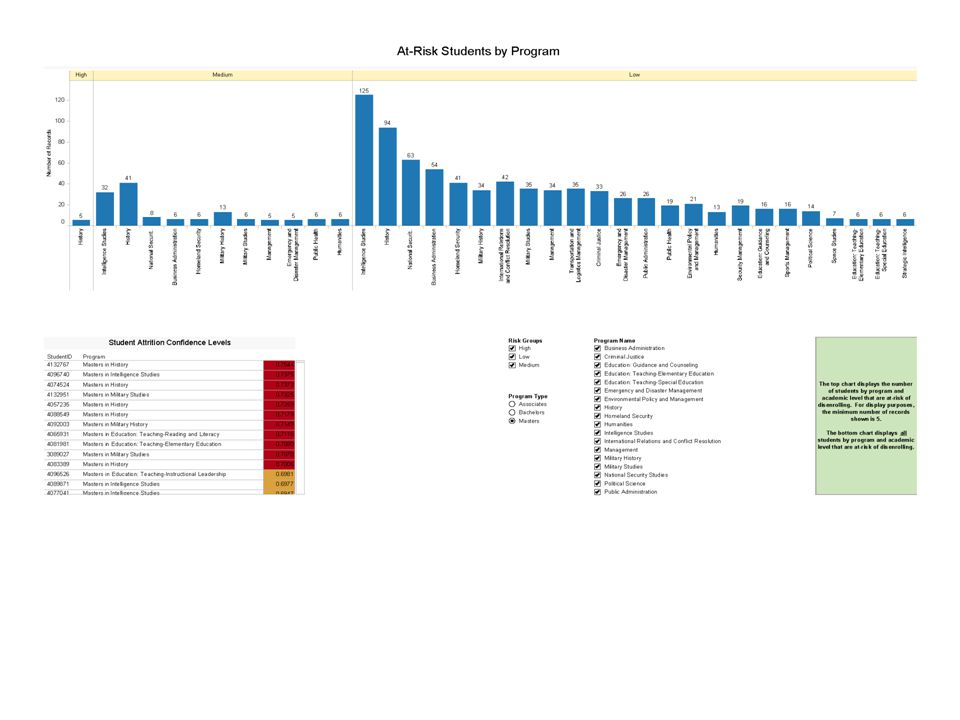
=loss annually in state and federal funds for student attrition $4.1 Billion = average % attrition rate for a 4 year degree at Pubic Universities 57% = average spend for a first year student by Public Universities $17K = value of retaining just 30 students $500K

5
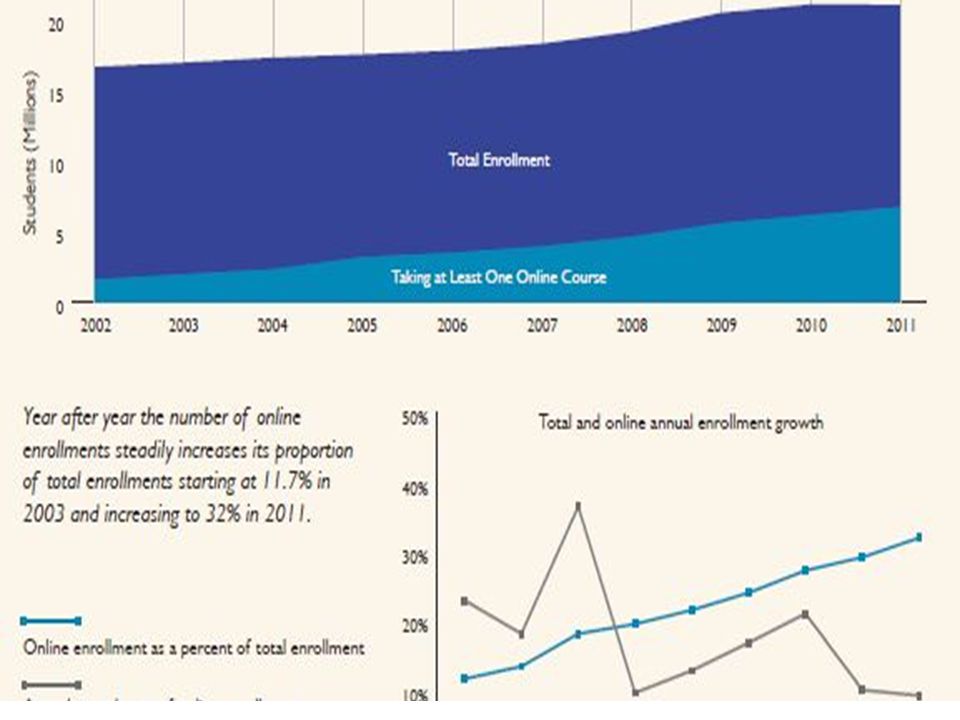
32% of all college students are now taking at least 1 online course 6.7 million enrollments

6
Problems Online failure / withdraw rates are up to 17 times higher than face to face Good theoretical models but little hard data Deluge of data – 8 data bases and 3 LMS’s per campus on average Education wants to reinvent the wheel Lack of stakeholder buy-in / institutional paralysis

7
Where are we headed? Business Models Provide Guidance

8
Connections All analyses and stakeholders are interrelated

9
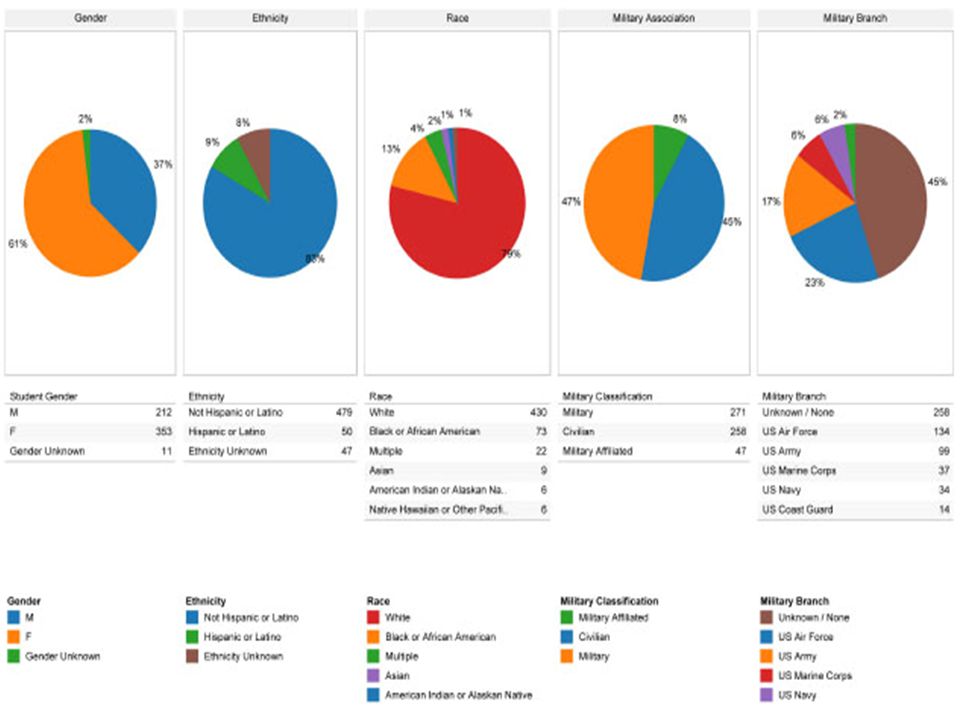
Levels of Analysis Start Simple and Build

12
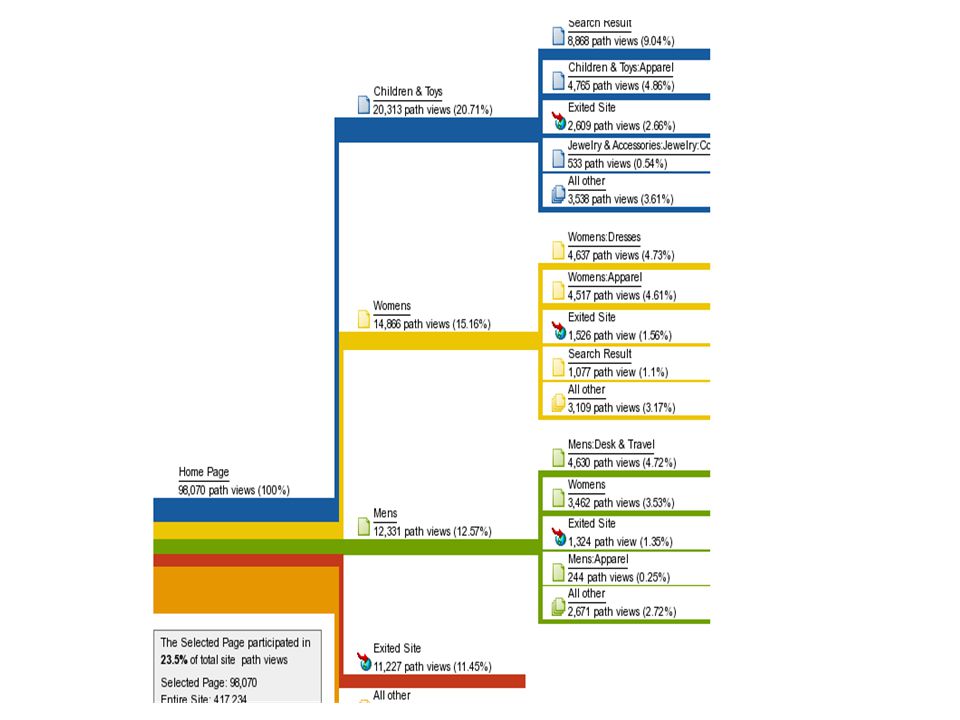
Make Data Consumable Visualize Utilize Measure Share Iterate

17
Visualize Interaction: Heat map Where are students clicking on page

18
Visualize Interaction: Overlays See the number of clicks on each element of your page.

Similar presentations


, 2003-04 to.>")


