Download presentation
Presentation is loading. Please wait.

1
Then and Now Dr. B.D. Maxfield Office of Army Demographics Blacks in the U.S. Army April 2004

2
Office of Army Demographics 2 Introduction Black Military Population –2003 U.S. Black Population and Army Black Population Blacks (Enlisted and Officers) - - All Services Active-Duty Army by Race/Ethnicity/ Gender Blacks in the Army Reserve/ National Guard Active-Duty Black Families Black Army Civilians POC/ Website
 - - All Services Active-Duty Army by Race/Ethnicity/ Gender Blacks in the Army Reserve/ National Guard Active-Duty Black Families Black Army Civilians POC/ Website.")
3
Office of Army Demographics 3 U.S. Black Population and Army Black Population* Rest of Army 79.7% Blacks 20.3% FY03 Army Population* 2003 U.S. Census Projections –U.S. Population of 18-55 year olds = 149 M Black Population of 18-55 year olds = 19 M –12.7% of 18-55 year old population are Black Rest of U.S. 87.3% 2003 U.S. Projected Population of 18-55 year olds Blacks 12.7% FY03 Army Population –Army Population* = 1,254 K Approx 254 K Blacks –20.3% of total Army population are Black * Includes Active-Duty Army, Army Reserves/National Guard and Army Civilians There is a higher percentage of Blacks in the FY03 Army Population* (20.3%) than in the comparative (i.e. 18-55 year olds) U.S. Population (12.7%).
 than in the comparative (i.e year olds) U.S. Population (12.7%)..")
4
Office of Army Demographics 4 Black Enlisted Population, All Services Percent TOTAL EnlistedARMYNAVYUSMCAIR FORCETOTAL #%#%#%#%#% FY83 210,14431.462,85512.735,81620.581,39316.8390,20821.4 FY93 147,30330.778,13217.828,72917.959,90016.8314,06421.9 FY03 108,43626.267,44220.922,44114.152,20917.6250,52821.0 Source: DMDC 3035 EO Report 83 93 03 Although Blacks have consistently comprised approximately one-fifth of the Active-Duty military (Enlisted) since FY83, there were significant differences by Service. The percentages of Black Enlisted in the Army and the Marine Corp have decreased since FY83, but increased significantly in the Navy.

5
Office of Army Demographics 5 Black Officer* Population, All Services Percent Source: DMDC 3035 EO Report TOTAL OfficersARMYNAVYUSMCAIR FORCETOTAL #%#%#%#%#% FY83 9,1278.62,0813.08524.35,4765.217,5365.8 FY93 9,74311.03,1304.79725.34,7385.618,5837.2 FY03 10,21412.84,1617.61,3627.34,8516.620,5889.1 83 93 03 Although little change has occurred in the percentage of Black Officers in the Air Force since FY83, there has been a slight increase in the percentages of Black Officers in the Army, Navy, and Marine Corp. * Officer includes Warrants

6
Office of Army Demographics 6 Source: DMDC Blacks in the “Total” Army Percent BlacksTotal FY83FY93FY03FY83FY93FY03 #%#%#%### TOTAL 395,07122.1326,75621.8253,86120.21,791,4321,500,1051,253,878 Active-Duty Army 219,27128.3157,04627.6118,65024.0775,260568,529493,563 Army Reserve/Guard 128,66618.8130,98819.1103,44218.4683,366685,819562,979 Army Civilians 47,13414.238,72215.831,76916.1332,806245,757197,336 TOTAL 83 93 03 The percentage of Blacks in the Active-Duty Army has decreased slightly since FY83; whereas, the percentages of Blacks in the Reserves/National Guard and Army Civilians jobs has remained fairly stable over time. Army

7
Active-Duty Army by Race/Ethnicity/Gender FY83, FY93 and FY03 Office of Army Demographics

8
8 FY03AsiansHispanicsBlacksWhitesTotal (Includes Other/Unknown) Non-Prior Service Accessions2,3668,46711,05046,75169,571 High School Diploma Graduate*95.1%94.2%95.3%86.9%89.5% Test Score Category I-IIIA**65.1%57.0%51.4%81.2%72.7% Females20.0%23.3%33.4%14.9%19.2% Males80.0%76.7%66.6%85.1%80.8% FY03 Army Enlisted Accessions Source: Enlisted Accessions Division * Does not include GEDs or GED+ The majority of FY03 Accessions were high school diploma graduates (90%). Black females were more likely to enlist in the Army in FY03 than were females from other race/ethnic groups.

9
Office of Army Demographics 9 FY83775,260 FY03493,563 FY93568,529 Active-Duty Army by Race/Ethnicity Source: DMDC 3035 EO Report WhiteBlackHispanicOtherAsian Since FY83, the percentages of Whites and Blacks in the Active-Duty Army have steadily decreased, while the percentage of Hispanics has increased (from 4% to 10%).
.")
10
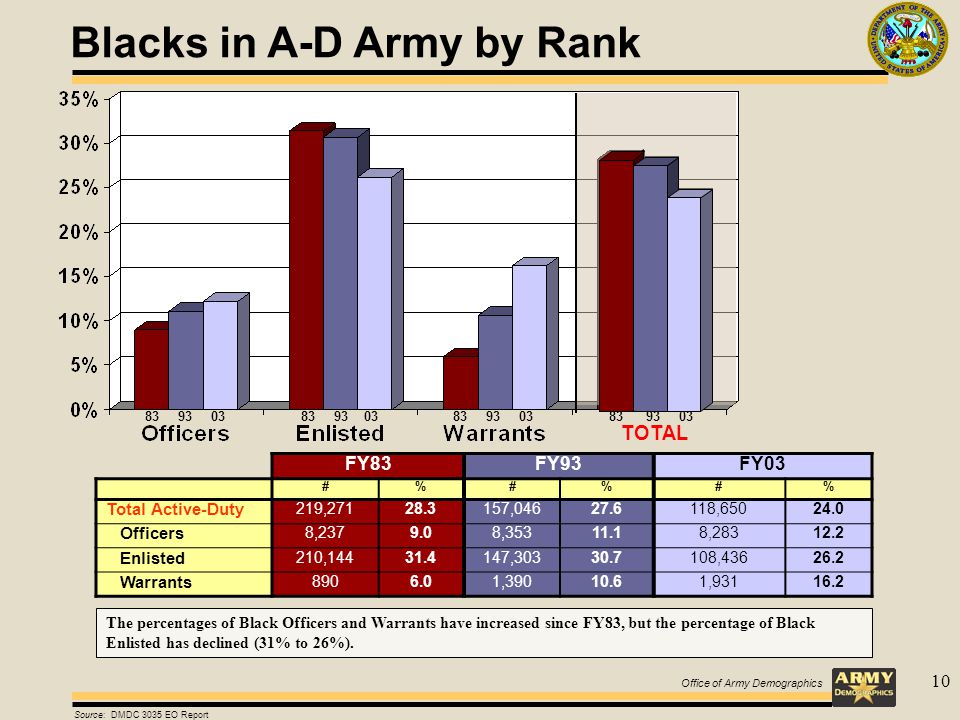
Office of Army Demographics 10 Blacks in A-D Army by Rank TOTAL FY83FY93FY03 #%#%#% Total Active-Duty 219,27128.3157,04627.6118,65024.0 Officers 8,2379.08,35311.18,28312.2 Enlisted 210,14431.4147,30330.7108,43626.2 Warrants 8906.01,39010.61,93116.2 Source: DMDC 3035 EO Report The percentages of Black Officers and Warrants have increased since FY83, but the percentage of Black Enlisted has declined (31% to 26%). 83 93 03
11
Office of Army Demographics 11 Active-Duty Army Blacks & Whites by Gender Active-Duty Blacks MalesFemales #%#% FY83190,11427.229,15738.6 FY93126,04525.331,00143.8 FY0388,48021.130,17040.3 Source: DMDC 3035 EO Report In the past 20 years, there has been a steady decline in the percentages of both Black and White males in the Active- Duty Army. In FY83, the percentage of Black females was significantly less than the percentage of white females; however, these percentages are virtually the same in FY03. BlacksWhites

12
Office of Army Demographics 12 Blacks in the Active-Duty Army by Gender and Rank FY83FY93FY03 MalesFemalesMalesFemalesMalesFemales #%#%#%#%#%#% Officers6,7038.21,53416.56,3059.82,04819.35,76610.12,51722.6 Enlisted182,54030.327,60441.8118,48428.228,81948.381,13323.127,30343.4 Warrants8715.91910.31,2569.913426.91,58114.335041.6 Enlisted Source: DMDC 3035 EO Report Percent Officers Percent Warrants Throughout the last 20 years, there continues to be a significantly higher percentage of Black females than Black males in all ranks of the Active-Duty Army. Females Males

13
Office of Army Demographics 13 Source: DMDC Ed Zapanta, Army Active-Duty Army Enlisted by CA, CS, CSS and Race/Ethnicity, FY03 Race/Ethnicity Combat Arms Combat Service Combat Service Support OtherTotal # Enlisted in Army % of Enlisted Force Blacks16%15%52%17%100%108,43626.2% Hispanics29%16%39%16%100%45,02910.9% Whites36%21%27%16%100%232,35056.2% Asians28%16%40%16%100%14,2443.4% Other/Unknown28%16%38%18%100%13,6383.3% Note: Percentages in CA, CS, CSS and Other are calculated for each race/ethnic group separately. Blacks are far more likely to be serving in Combat Service Support jobs (52%) than they are in Combat Arms or Combat Services.
 than they are in Combat Arms or Combat Services..")
14
Blacks in the Army Reserve/National Guard Office of Army Demographics

15
15 National Guard TOTAL Reserves TOTAL Percent Blacks in Army Reserves and Army National Guard Army ReservesArmy National Guard FY83 (266,188) FY93 (275,900) FY03 (211,890) FY83 (417,178) FY93 (409,919) FY03 (351,089) #%#%#%#%#%#% TOTAL 59,97222.566,96624.351,85724.568,69416.564,02215.651,58514.7 Officers 3,0276.66,04111.76,06416.11,7335.32,7287.32,3668.0 Enlisted 56,76826.360,65027.645,44826.566,82717.861,08416.848,93315.6 Warrants 1774.12756.234512.91341.52102.32863.9 Source: DMDC 3035 EO Report 83 93 03 Black Officers and Warrants in both the Army Reserves and National Guard have increased since FY83; whereas, the percentage of Black Enlisted has remained fairly stable over time.
 FY93 (275,900) FY03 (211,890) FY83 (417,178) FY93 (409,919) FY03 (351,089) #%#%#%#%#%#% TOTAL 59, , , , , , Officers 3, , , , , , Enlisted 56, , , , , , Warrants Source: DMDC 3035 EO Report Black Officers and Warrants in both the Army Reserves and National Guard have increased since FY83; whereas, the percentage of Black Enlisted has remained fairly stable over time.")
16
Office of Army Demographics 16 Blacks in the Army Reserves by Gender Black Reserves MalesFemales #%#% FY8344,79020.015,18235.8 FY9345,38320.821,58337.7 FY0332,73720.419,12037.1 Source: DMDC 3035 EO Report The percentage of Blacks in the Army Reserves for both males and females, have changed only slightly over the past 20 years. However, there is a higher percentage of Black females in the Army Reserves than Black males.

17
Office of Army Demographics 17 Blacks in the Army Reserves by Gender and Rank FY83FY93FY03 MalesFemalesMalesFemalesMalesFemales #%#%#%#%#%#% Officers2,0525.297516.23,5628.92,47921.33,58412.62,48026.8 Enlisted42,57323.714,19539.141,59123.919,05942.028,90722.316,54139.5 Warrants1654.01210.52305.54517.124610.49930.4 Source: DMDC 3035 EO Report Throughout the past 20 years, the percentage of Black females in the Army Reserves continues to be significantly higher than the percentage of Black males in the Reserves across all ranks. Enlisted Percent Officers Percent Warrants Females Males

18
Office of Army Demographics 18 Blacks in the Army National Guard by Gender National Guard Blacks MalesFemales #%#% FY8361,97915.76,71530.5 FY9355,36514.68,65727.6 FY0340,41913.211,16625.2 Source: DMDC 3035 EO Report Blacks in the National Guard, for both male and female, have declined slightly over the past 20 years. However, there is a higher percentage of Black females in the National Guard than there are Black males.

19
Office of Army Demographics 19 FY83FY93FY03 MalesFemalesMalesFemalesMalesFemales #%#%#%#%#%#% Officers1,4474.728614.72,1886.454015.71,8497.051716.0 Enlisted60,40517.06,42232.252,99415.88,09029.238,34214.010,59126.1 Warrants1271.576.81832.12710.22283.45812.2 Source: DMDC 3035 EO Report Blacks in the Army National Guard by Gender and Rank Throughout the past 20 years, the percentage of Black females in the Army National Guard continue to be greater than the percentage of Black males in the Guard across all ranks. It should be noted that the percentage of Black males and females in the Enlisted ranks have declined steadily since FY83. Enlisted Percent Officers Percent Warrants Females Males

20
Black Families Marriages – Joint and Civilian Single – with children Office of Army Demographics

21
21 A-D Blacks Married by Rank FY93 (157K) FY03 (118.6K) Grades#%#% Officers5,72368.55,15762.3 Enlisted88,79960.358,68654.1 Warrants1,20786.61,55980.7 Source: DMDC 93 03 Note: Percentages are based on the number of married Blacks in a specific grade divided by the TOTAL number of Blacks in that specific grade. Compared to FY93, there is a decline in the percentage of married Blacks serving in the Army today. However, compared to the marital rate for the total Active-Duty Army, Blacks have a slightly higher marital rate. Total Blacks Total Active-Duty 61% 59% 52% 55%

22
Office of Army Demographics 22 Black Families MarriagesFY93FY03 #%#% Joint Service Marriages16,12016.8*10,84616.6* Civilian Marriages79,60983.2*54,55683.4* SingleFY93FY03 #%#% Single46,21429.437,67031.7 Single with Child15,1039.615,57813.1 * Percentage based on Active-Duty married Blacks Source: DMDC There has been a slight increase in the percentage of single Blacks serving in the Army since FY93, and the percentage of single Black parents is increasing. The percentages of Active-Duty Black Joint Service marriages and Black Civilian marriages have remained relatively stable over the past 10 years.

23
Black Army Civilians Office of Army Demographics

24
24 Black Army Civilians by Gender Source: DMDC 3038D Report Black Army Civilians MalesFemales #%#% FY8323,26911.523,86518.3 FY9317,11811.721,60421.7 FY0314,34812.017,42122.3 Since FY83 for Blacks, women are more likely to hold Army Civilian jobs than their male counterpart. However, since FY83, there has been a steady increase in the percentage of both Black males and Black females holding Army Civilian jobs.

25
Office of Army Demographics 25 Black Army Civilians by Rank Source: DMDC 3038D Report Black Army Civilians FY83FY93FY03 #%#%#% GS 1-4 11,46520.36,41531.53,56930.3 GS 5-8 10,97914.612,57421.310,03123.8 GS 9-12 6,5837.99,46111.09,49314.0 GS 13-15/GM 7793.51,5715.32,0788.0 SES 133.862.2124.7 TOTAL29,81930,02725,183 The percentage of Blacks holding Army Civilian jobs has increased since FY83; however, Black Army Civilians are far more likely to be employed in GS 1-8 jobs than they are in the GS 9+ jobs.

26
Office of Army Demographics 26 FY83FY93FY03 MalesFemalesMalesFemalesMalesFemales Grades#%#%#%#%#%#% GS 1-42,76922.28,69619.81,43327.64,98232.997923.72,59033.9 GS 5-83,28513.37,69415.23,39618.89,17822.43,03319.16,99826.6 GS 9-123,4515.63,13214.24,5048.54,95715.24,28110.95,21218.3 GS 13-15/GM6303.014911.09994.157211.51,1155.896314.0 SES123.6110.062.30083.849.1 FY 2003 Black Army Civilians by Rank and Gender FY 1993 FY 1983 Source: DMDC 3038D Report Note: Percentages are based on the number of Blacks in a specific grade divided by the TOTAL number in that specific grade. A higher percentage of Black females hold Army Civilian jobs than Black males. For both male and female Blacks, however, the percentage holding Army Civilian jobs declines for the more senior-level positions. Males Females

27
Office of Army Demographics 27 Dr. B. D. Maxfield Chief Office of Army Demographics E-mail: Betty.Maxfield@HQDA.Army.mil Comm: 703-696-5128 (DSN 426) Fax: 703-696-5635 http://www.armyg1.army.mil POC / Website
 Fax: POC / Website.")
Similar presentations


 pantry survey found that.>")


 Grants Chapter 6.>")