Download presentation
Presentation is loading. Please wait.

1
Everything you always wanted to know about stars…
Material from Chapters 8 and 9 in Horizons by Seeds Everything you always wanted to know about stars…

2
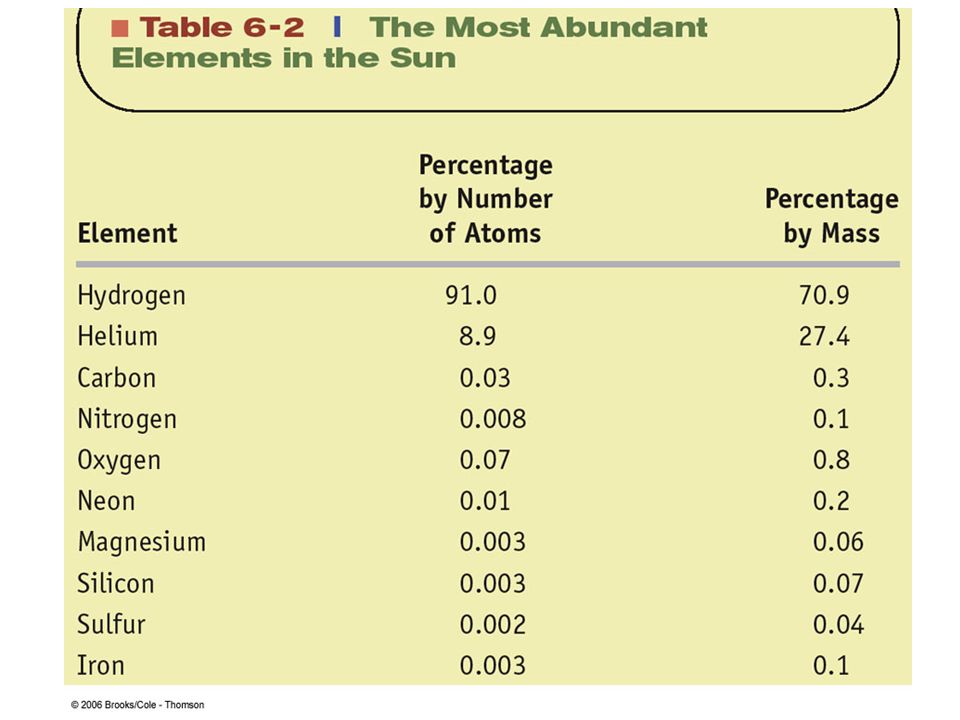
The Spectra of Stars Inner, dense layers of a star produce a continuous (black body) spectrum. Cooler surface layers absorb light at specific frequencies. Spectra of stars are absorption spectra. Spectrum provides temperature, chemical composition

3
The Balmer Thermometer
Balmer line strength is sensitive to temperature: Most hydrogen atoms are ionized => weak Balmer lines Almost all hydrogen atoms in the ground state (electrons in the n = 1 orbit) => few transitions from n = 2 => weak Balmer lines
 => few transitions from n = 2 => weak Balmer lines.")
4
Measuring the Temperatures of Stars
Comparing line strengths, we can measure a star’s surface temperature!

5
Spectral Classification of Stars (I)
Different types of stars show different characteristic sets of absorption lines. Temperature

6
Spectral Classification of Stars (II)
")
7
Mnemonics to remember the spectral sequence:
Mnemonics to remember the spectral sequence: Oh Only Be Boy, Bad A An Astronomers Fine F Forget Girl/Guy Grade Generally Kiss Kills Known Me Mnemonics

8
Stellar spectra O B A F Surface temperature G K M

10
We have learned how to determine a star’s
We have learned how to determine a star’s surface temperature chemical composition Now we can determine its distance luminosity radius mass and how all the different types of stars make up the big family of stars.

11
Distances to Stars __ 1 d = p Trigonometric Parallax: 1 pc = 3.26 LY
d in parsec (pc) p in arc seconds __ 1 d = p Trigonometric Parallax: Star appears slightly shifted from different positions of Earth on its orbit 1 pc = 3.26 LY The farther away the star is (larger d), the smaller the parallax angle p.
 p in arc seconds. __. 1. d = p. Trigonometric Parallax: Star appears slightly shifted from different positions of Earth on its orbit. 1 pc = 3.26 LY. The farther away the star is (larger d), the smaller the parallax angle p.")
12
The Trigonometric Parallax
Example: Nearest star, Centauri, has a parallax of p = 0.76 arc seconds d = 1/p = 1.3 pc = 4.3 LY With ground-based telescopes, we can measure parallaxes p ≥ 0.02 arc sec => d ≤ 50 pc This method does not work for stars farther away than about 50 pc (nearly 200 light-years).
.")
13
The more distant a light source is, the fainter it appears.
Intrinsic Brightness The more distant a light source is, the fainter it appears. The same amount of light falls onto a smaller area at distance 1 than at distance 2 => smaller apparent brightness. Area increases as square of distance => apparent brightness decreases as inverse of distance squared

14
Intrinsic Brightness / Flux and Luminosity
The flux received from the light is proportional to its intrinsic brightness or luminosity (L) and inversely proportional to the square of the distance (d): L __ F ~ d2 Star A Star B Earth Both stars may appear equally bright, although star A is intrinsically much brighter than star B.
 and inversely proportional to the square of the distance (d): L. __. F ~ d2. Star A. Star B. Earth. Both stars may appear equally bright, although star A is intrinsically much brighter than star B.")
15
The Size (Radius) of a Star
We already know: flux increases with surface temperature (~ T4); hotter stars are brighter. But brightness also increases with size: Star B will be brighter than star A. A B Absolute brightness is proportional to radius squared, L ~ R2. Quantitatively: L = 4 R2 T4 Surface flux due to a blackbody spectrum Surface area of the star
; hotter stars are brighter. But brightness also increases with size: Star B will be brighter than star A. A. B. Absolute brightness is proportional to radius squared, L ~ R2. Quantitatively: L = 4 R2 T4. Surface flux due to a blackbody spectrum. Surface area of the star.")
16
Thus, Polaris is 100 times larger than the sun.
Example: Polaris has just about the same spectral type (and thus surface temperature) as our sun, but it is 10,000 times brighter than our sun. Thus, Polaris is 100 times larger than the sun. This causes its luminosity to be 1002 = 10,000 times more than our sun’s.
 as our sun, but it is 10,000 times brighter than our sun. Thus, Polaris is 100 times larger than the sun. This causes its luminosity to be 1002 = 10,000 times more than our sun’s.")
17
Organizing the Family of Stars: The Hertzsprung-Russell Diagram
We know: Stars have different temperatures, different luminosities, and different sizes. To bring some order into that zoo of different types of stars: organize them in a diagram of Luminosity versus Temperature (or spectral type) Absolute mag. Hertzsprung-Russell Diagram Luminosity or Temperature Spectral type: O B A F G K M
 Absolute mag. Hertzsprung-Russell Diagram. Luminosity. or. Temperature. Spectral type: O B A F G K M.")
18
Most stars are found along the main sequence
The Hertzsprung Russell Diagram Most stars are found along the main sequence

19
Stars spend most of their active life time on the Main Sequence.
The Hertzsprung-Russell Diagram (II) Same temperature, but much brighter than MS stars Must be much larger Stars spend most of their active life time on the Main Sequence. Giant Stars Same temp., but fainter → Dwarfs
 Same temperature, but much brighter than MS stars. Must be much larger. Stars spend most of their active life time on the Main Sequence. Giant Stars. Same temp., but fainter → Dwarfs.")
20
Radii of Stars in the Hertzsprung-Russell Diagram
Rigel Betelgeuse 10,000 times the sun’s radius Polaris 100 times the sun’s radius Sun As large as the sun 100 times smaller than the sun

21
Luminosity Classes Ia Bright Supergiants Ib Supergiants
Ia Bright Supergiants Ia Ib Ib Supergiants II II Bright Giants III III Giants IV Subgiants IV V V Main-Sequence Stars

22
Luminosity effects on the width of spectral lines
Same spectral type, but different luminosity Lower gravity near the surfaces of giants smaller pressure smaller effect of pressure broadening narrower lines

23
Examples: Our Sun: G2 star on the main sequence: G2V
Our Sun: G2 star on the main sequence: G2V Polaris: G2 star with supergiant luminosity: G2Ib

24
Binary Stars More than 50% of all stars in our Milky Way are not single stars, but belong to binaries: Pairs or multiple systems of stars which orbit their common center of mass. If we can measure and understand their orbital motion, we can estimate the stellar masses.

25
The Center of Mass center of mass = balance point of the system.
center of mass = balance point of the system. Both masses equal => center of mass is in the middle, rA = rB. The more unequal the masses are, the more it shifts toward the more massive star.

26
“Placeholder” on Masses
We can get masses of stars by measuring how they move in binary systems according to Newton’s Law of Gravitation. I’ll save some of the details for exo-solar planets session. Plenty of other things to cover right now…

27
Masses of Stars in the Hertzsprung-Russell Diagram
Masses in units of solar masses The higher a star’s mass, the more luminous (brighter) it is: High masses L ~ M3.5 High-mass stars have much shorter lives than low-mass stars: Mass tlife ~ M-2.5 Low masses Sun: ~ 10 billion yr. 10 Msun: ~ 30 million yr. 0.1 Msun: ~ 3 trillion yr.
 it is: High masses. L ~ M3.5. High-mass stars have much shorter lives than low-mass stars: Mass. tlife ~ M-2.5. Low masses. Sun: ~ 10 billion yr. 10 Msun: ~ 30 million yr. 0.1 Msun: ~ 3 trillion yr.")
28
The Mass-Luminosity Relation
More massive stars are more luminous. L ~ M3.5

29
Determine properties of all stars within a certain volume.
Surveys of Stars Ideal situation: Determine properties of all stars within a certain volume. Problem: Fainter stars are hard to observe; we might be biased towards the more luminous stars.

31
A Census of the Stars Faint, red dwarfs (low mass) are the most common stars. Bright, hot, blue main-sequence stars (high- mass) are very rare. Giants and supergiants are extremely rare.
 are very rare. Giants and supergiants are extremely rare.")
32
The Interstellar Medium (ISM)
The space between the stars is not completely empty, but filled with very dilute gas and dust, producing some of the most beautiful objects in the sky. We are interested in the interstellar medium because a) dense interstellar clouds are the birth place of stars b) dark clouds alter and absorb the light from stars behind them
 dense interstellar clouds are the birth place of stars. b) dark clouds alter and absorb the light from stars behind them.")
33
The Various Appearances of the ISM

34
Three kinds of nebulae 1) Emission Nebulae (HII Regions)
1) Emission Nebulae (HII Regions) Hot star illuminates a gas cloud; excites and/or ionizes the gas (electrons kicked into higher energy states); electrons recombining, falling back to ground state produce emission lines. The Fox Fur Nebula NGC 2246 The Trifid Nebula
 Emission Nebulae (HII Regions) Hot star illuminates a gas cloud; excites and/or ionizes the gas (electrons kicked into higher energy states); electrons recombining, falling back to ground state produce emission lines. The Fox Fur Nebula. NGC The Trifid Nebula.")
35
2) Reflection Nebulae Star illuminates gas and dust cloud;
Star illuminates gas and dust cloud; star light is reflected by the dust; reflection nebula appears blue because blue light is scattered by larger angles than red light; Same phenomenon makes the day sky appear blue (if it’s not cloudy).
.")
36
Emission and Reflection Nebulae

37
3) Dark Nebulae Dense clouds of gas and dust absorb the light from the stars behind; appear dark in front of the brighter background; Barnard 86 Horsehead Nebula

38
Interstellar Reddening
Blue light is strongly scattered and absorbed by interstellar clouds Red light can more easily penetrate the cloud, but is still absorbed to some extent Infrared radiation is hardly absorbed at all Barnard 68 Interstellar clouds make background stars appear redder Infrared Visible

39
Interstellar Absorption Lines
The interstellar medium produces absorption lines in the spectra of stars. These can be distinguished from stellar absorption lines through: a) Absorption from wrong ionization states Narrow absorption lines from Ca II: Too low ionization state and too narrow for the O star in the background; multiple components b) Small line width (too low temperature; too low density) c) Multiple components (several clouds of ISM with different radial velocities)
 Absorption from wrong ionization states. Narrow absorption lines from Ca II: Too low ionization state and too narrow for the O star in the background; multiple components. b) Small line width (too low temperature; too low density) c) Multiple components (several clouds of ISM with different radial velocities)")
40
Structure of the ISM HI clouds: Hot intercloud medium:
The ISM occurs in two main types of clouds: HI clouds: Cold (T ~ 100 K) clouds of neutral hydrogen (HI); moderate density (n ~ 10 – a few hundred atoms/cm3); size: ~ 100 pc Hot intercloud medium: Hot (T ~ a few 1000 K), ionized hydrogen (HII); low density (n ~ 0.1 atom/cm3); gas can remain ionized because of very low density.
 clouds of neutral hydrogen (HI); moderate density (n ~ 10 – a few hundred atoms/cm3); size: ~ 100 pc. Hot intercloud medium: Hot (T ~ a few 1000 K), ionized hydrogen (HII); low density (n ~ 0.1 atom/cm3); gas can remain ionized because of very low density.")
41
The Various Components of the Interstellar Medium
Infrared observations reveal the presence of cool, dusty gas. X-ray observations reveal the presence of hot gas.

42
Shocks Triggering Star Formation
Henize 206 (infrared)
")
43
The Contraction of a Protostar

44
From Protostars to Stars
Star emerges from the enshrouding dust cocoon Ignition of H He fusion processes

45
Evidence of Star Formation
Nebula around S Monocerotis: Contains many massive, very young stars, including T Tauri Stars: strongly variable; bright in the infrared.

46
Protostellar Disks and Jets – Herbig-Haro Objects
Disks of matter accreted onto the protostar (“accretion disks”) often lead to the formation of jets (directed outflows; bipolar outflows): Herbig-Haro objects
 often lead to the formation of jets (directed outflows; bipolar outflows): Herbig-Haro objects.")
47
Protostellar Disks and Jets – Herbig-Haro Objects (II)
Herbig-Haro Object HH34

48
Herbig-Haro 34 in Orion Jet along the axis visible as red
Lobes at each end where jets run into surrounding gas clouds

49
Motion of Herbig-Haro 34 in Orion
Can actually see the knots in the jet move with time In time jets, UV photons, supernova, will disrupt the stellar nursery Hubble Space Telescope Image

50
Globules Evaporating gaseous globules (“EGGs”): Newly forming stars exposed by the ionizing radiation from nearby massive stars
: Newly forming stars exposed by the ionizing radiation from nearby massive stars.")
51
The Source of Stellar Energy
Stars produce energy by nuclear fusion of hydrogen into helium. In the sun, this happens primarily through the proton-proton (PP) chain
 chain.")
52
The CNO Cycle the CNO cycle.
In stars slightly more massive than the sun, a more powerful energy generation mechanism than the PP chain takes over: the CNO cycle.

53
Fusion into Heavier Elements
Fusion into heavier elements than C, O: requires very high temperatures; occurs only in very massive stars (more than 8 solar masses).
.")
54
Hydrostatic Equilibrium
Imagine a star’s interior composed of individual shells Within each shell, two forces have to be in equilibrium with each other: Gravity, i.e. the weight from all layers above Outward pressure from the interior

55
Hydrostatic Equilibrium (II)
Outward pressure force must exactly balance the weight of all layers above everywhere in the star. This condition uniquely determines the interior structure of the star. This is why we find stable stars on such a narrow strip (main sequence) in the Hertzsprung-Russell diagram.
 in the Hertzsprung-Russell diagram.")
56
The structure and evolution of a star is determined by the laws of
Stellar Models The structure and evolution of a star is determined by the laws of Hydrostatic equilibrium Energy transport Conservation of mass Conservation of energy A star’s mass (and chemical composition) completely determines its properties. That’s why stars initially all line up along the main sequence.
 completely determines its properties. That’s why stars initially all line up along the main sequence.")
57
The Life of Main-Sequence Stars
Stars gradually exhaust their hydrogen fuel. In this process of aging, they are gradually becoming brighter, evolving off the zero-age main sequence.

58
Lifetime on Main Sequence
L M3.5 T fuel / L = M/M3.5 = M-2.5 Example: M=2 MSun L = 11.3 LSun T =1/5.7 TSun Spectral Type Mass (Sun = 1) Luminosity (Sun = 1) Years on Main Sequence O5 40 405,000 1 106 B0 15 13,000 11 106 A0 3.5 80 440 106 F0 1.7 6.1 3 109 G0 1.1 1.4 8 109 K0 0.8 0.46 17 109 M0 0.5 0.08 56 109
 Luminosity (Sun = 1) Years on Main Sequence. O , 106. B , 106. A 106. F 109. G 109. K 109. M 109.")
59
The Deaths and End States of Stars
Material from Seeds chapters 10-11 The Deaths and End States of Stars

60
Less massive stars will die in less dramatic events.
The End of a Star’s Life When all the nuclear fuel in a star is used up, gravity will win over pressure and the star will die. High-mass stars will die first, in a gigantic explosion, called a supernova. Less massive stars will die in less dramatic events.

61
Evolution off the Main Sequence: Expansion into a Red Giant
Hydrogen in the core completely converted into He: “Hydrogen burning” (i.e. fusion of H into He) ceases in the core. H burning continues in a shell around the core. He core + H-burning shell produce more energy than needed for pressure support Expansion and cooling of the outer layers of the star red giant
 ceases in the core. H burning continues in a shell around the core. He core + H-burning shell produce more energy than needed for pressure support. Expansion and cooling of the outer layers of the star red giant.")
62
Expansion onto the Giant Branch
Expansion and surface cooling during the phase of an inactive He core and a H-burning shell Sun will expand beyond Earth’s orbit!

63
Degenerate Matter Matter in the He core has no energy source left. Not enough thermal pressure to resist and balance gravity Matter assumes a new state, called degenerate matter Electron energy Pressure in degenerate core is due to the fact that electrons can not be packed arbitrarily close together and have small energies.

64
Red Giant Evolution H-burning shell keeps dumping He onto the core.
H-burning shell keeps dumping He onto the core. He core gets denser and hotter until the next stage of nuclear burning can begin in the core: He fusion through the “triple-alpha process”: 4He + 4He 8Be + 8Be + 4He 12C + The onset of this process is termed the helium flash

65
Evidence for Stellar Evolution: Star Clusters
Stars in a star cluster all have approximately the same age! More massive stars evolve more quickly than less massive ones. If you put all the stars of a star cluster on a HR diagram, the most massive stars (upper left) will be missing!
 will be missing!")
66
HR Diagram of a Star Cluster
High-mass stars evolved onto the giant branch Turn-off point Low-mass stars still on the main sequence

67
Estimating the Age of a Cluster
The lower on the MS the turn-off point, the older the cluster.

68
Red Dwarfs Recall: Stars with less than ~ 0.4 solar masses are completely convective. Mass Hydrogen and helium remain well mixed throughout the entire star. No phase of shell “burning” with expansion to giant. Star not hot enough to ignite He burning.

69
Sunlike Stars Expansion to red giant during H burning shell phase
Sunlike stars (~ 0.4 – 4 solar masses) develop a helium core. Mass Expansion to red giant during H burning shell phase Ignition of He burning in the He core Formation of a degenerate C,O core
 develop a helium core. Mass. Expansion to red giant during H burning shell phase. Ignition of He burning in the He core. Formation of a degenerate C,O core.")
70
White Dwarfs white dwarfs: Mass ~ Msun Temp. ~ 25,000 K
Degenerate stellar remnant (C,O core) Extremely dense: 1 teaspoon of white dwarf material: mass ≈ 16 tons!!! Chunk of white dwarf material the size of a beach ball would outweigh an ocean liner! white dwarfs: Mass ~ Msun Temp. ~ 25,000 K Luminosity ~ 0.01 Lsun
 Extremely dense: 1 teaspoon of white dwarf material: mass ≈ 16 tons!!! Chunk of white dwarf material the size of a beach ball would outweigh an ocean liner! white dwarfs: Mass ~ Msun. Temp. ~ 25,000 K. Luminosity ~ 0.01 Lsun.")
71
Low luminosity; high temperature => White dwarfs are found in the lower center/left of the H-R diagram.

72
The Chandrasekhar Limit
The more massive a white dwarf, the smaller it is. Pressure becomes larger, until electron degeneracy pressure can no longer hold up against gravity. WDs with more than ~ 1.4 solar masses can not exist!

73
The Final Breaths of Sun-Like Stars: Planetary Nebulae
Remnants of stars with ~ 1 – a few Msun Radii: R ~ light years Expanding at ~10 – 20 km/s ( Doppler shifts) Less than 10,000 years old Have nothing to do with planets! The Helix Nebula
 Less than 10,000 years old. Have nothing to do with planets! The Helix Nebula.")
74
The Formation of Planetary Nebulae
Two-stage process: Slow wind from a red giant blows away cool, outer layers of the star The Ring Nebula in Lyra Fast wind from hot, inner layers of the star overtakes the slow wind and excites it => planetary nebula

75
Planetary Nebulae Often asymmetric, possibly due to Stellar rotation
Often asymmetric, possibly due to Stellar rotation Magnetic fields Dust disks around the stars The Butterfly Nebula

76
A Gallery of P-N from Hubble

77
Mass Transfer in Binary Stars
In a binary system, each star controls a finite region of space, bounded by the Roche lobes (or Roche surfaces). Lagrangian points = points of stability, where matter can remain without being pulled toward one of the stars. Matter can flow over from one star to another through the inner lagrange point L1.
. Lagrangian points = points of stability, where matter can remain without being pulled toward one of the stars. Matter can flow over from one star to another through the inner lagrange point L1.")
78
Recycled Stellar Evolution
Recycled Stellar Evolution Mass transfer in a binary system can significantly alter the stars’ masses and affect their stellar evolution.

79
White Dwarfs in Binary Systems
Binary consisting of white dwarf + main-sequence or red giant star => WD accretes matter from the companion X ray emission Angular momentum conservation => accreted matter forms a disk, called accretion disk. T ~ 106 K Matter in the accretion disk heats up to ~ 1 million K => X ray emission => “X ray binary”.

80
Explosive onset of H fusion
Nova Explosions Hydrogen accreted through the accretion disk accumulates on the surface of the white dwarf Very hot, dense layer of non-fusing hydrogen on the white dwarf surface Nova Cygni 1975 Explosive onset of H fusion Nova explosion

81
Recurrent Novae T Pyxidis In many cases, the mass transfer cycle resumes after a nova explosion. Cycle of repeating explosions every few years – decades.

82
The Fate of our Sun and the End of Earth
Sun will expand to a red giant in ~ 5 billion years Expands to ~ Earth’s orbit Earth will then be incinerated! Sun may form a planetary nebula (but uncertain) Sun’s C,O core will become a white dwarf
 Sun’s C,O core will become a white dwarf.")
84
The Deaths of Massive Stars: Supernovae
Final stages of fusion in high-mass stars (> 8 Msun), leading to the formation of an iron core, happen extremely rapidly: Si burning lasts only for ~ 1 day. Iron core ultimately collapses, triggering an explosion that destroys the star: Supernova
, leading to the formation of an iron core, happen extremely rapidly: Si burning lasts only for ~ 1 day. Iron core ultimately collapses, triggering an explosion that destroys the star: Supernova.")
85
The Crab Nebula–Supernova from 1050 AD
Can see expansion between 1973 and 2001 Kitt Peak National Observatory Images

86
Remnant of a supernova observed in a.d. 1054
Supernova Remnants X rays The Crab Nebula: Remnant of a supernova observed in a.d. 1054 The Veil Nebula Optical Cassiopeia A The Cygnus Loop

87
The Famous Supernova of 1987: Supernova 1987A
Before At maximum Unusual type II supernova in the Large Magellanic Cloud in Feb. 1987

88
Observations of Supernovae
Supernovae can easily be seen in distant galaxies. Supernova 1994D in NGC 4526

89
Type I and II Supernovae
Core collapse of a massive star: type II supernova If an accreting white dwarf exceeds the Chandrasekhar mass limit, it collapses, triggering a type Ia supernova. Type I: No hydrogen lines in the spectrum Type II: Hydrogen lines in the spectrum

90
The central core will collapse into a compact object of ~ a few Msun.
Neutron Stars A supernova explosion of an M > 8 Msun star blows away its outer layers. Pressure becomes so high that electrons and protons combine to form stable neutrons throughout the object. The central core will collapse into a compact object of ~ a few Msun. Typical size: R ~ 10 km Mass: M ~ 1.4 – 3 Msun Density: ~ 1014 g/cm3 Piece of neutron star matter of the size of a sugar cube has a mass of ~ 100 million tons!!!

91
Discovery of Pulsars Angular momentum conservation
Angular momentum conservation => Collapsing stellar core spins up to periods of ~ a few milliseconds. Magnetic fields are amplified up to B ~ 109 – 1015 G. (up to 1012 times the average magnetic field of the sun) => Rapidly pulsed (optical and radio) emission from some objects interpreted as spin period of neutron stars
 => Rapidly pulsed (optical and radio) emission from some objects interpreted as spin period of neutron stars.")
92
The Crab Pulsar Remnant of a supernova observed in A.D. 1054
Pulsar wind + jets Remnant of a supernova observed in A.D. 1054

93
The Crab Pulsar Visual image X-ray image

94
Light curves of the Crab Pulsar

95
The Lighthouse Model of Pulsars
A pulsar’s magnetic field has a dipole structure, just like Earth. Radiation is emitted mostly along the magnetic poles.

96
Images of Pulsars and other Neutron Stars
The Vela pulsar moving through interstellar space The Crab Nebula and pulsar

97
Neutron Stars in Binary Systems: X-ray binaries
Example: Her X-1 Star eclipses neutron star and accretion disk periodically 2 Msun (F-type) star Neutron star Orbital period = 1.7 days Accretion disk material heats to several million K => X-ray emission
 star. Neutron star. Orbital period = 1.7 days. Accretion disk material heats to several million K => X-ray emission.")
98
Some pulsars have planets orbiting around them.
Pulsar Planets Some pulsars have planets orbiting around them. Just like in binary pulsars, this can be discovered through variations of the pulsar period. As the planets orbit around the pulsar, they cause it to wobble around, resulting in slight changes of the observed pulsar period.

99
Neutron stars can not exist with masses > 3 Msun
Black Holes Just like white dwarfs (Chandrasekhar limit: 1.4 Msun), there is a mass limit for neutron stars: Neutron stars can not exist with masses > 3 Msun We know of no mechanism to halt the collapse of a compact object with > 3 Msun. It will collapse into a single point – a singularity: => A black hole!
, there is a mass limit for neutron stars: Neutron stars can not exist with masses > 3 Msun. We know of no mechanism to halt the collapse of a compact object with > 3 Msun. It will collapse into a single point – a singularity: => A black hole!")
100
Escape Velocity Velocity needed to escape Earth’s gravity from the surface: vesc ≈ 11.6 km/s. vesc Now, gravitational force decreases with distance (~ 1/d2) => Starting out high above the surface => lower escape velocity. vesc If you could compress Earth to a smaller radius => higher escape velocity from the surface. vesc
 => Starting out high above the surface => lower escape velocity. vesc. If you could compress Earth to a smaller radius => higher escape velocity from the surface. vesc.")
101
The Schwarzschild Radius
=> There is a limiting radius where the escape velocity reaches the speed of light, c: 2GM ____ Vesc = c Rs = c2 G = gravitational constant M = mass Rs is called the Schwarzschild radius.

102
Schwarzschild Radius and Event Horizon
No object can travel faster than the speed of light => nothing (not even light) can escape from inside the Schwarzschild radius We have no way of finding out what’s happening inside the Schwarzschild radius. “Event horizon”
 can escape from inside the Schwarzschild radius. We have no way of finding out what’s happening inside the Schwarzschild radius. Event horizon")
104
“Black Holes Have No Hair”
Matter forming a black hole is losing almost all of its properties. black holes are completely determined by 3 quantities: mass angular momentum (electric charge)
")
105
The Gravitational Field of a Black Hole
Gravitational Potential Distance from central mass The gravitational potential (and gravitational attraction force) at the Schwarzschild radius of a black hole becomes infinite.
 at the Schwarzschild radius of a black hole becomes infinite.")
106
General Relativity Effects Near Black Holes
An astronaut descending down towards the event horizon of the black hole will be stretched vertically (tidal effects) and squeezed laterally.
 and squeezed laterally.")
107
General Relativity Effects Near Black Holes (II)
Time dilation Clocks starting at 12:00 at each point. After 3 hours (for an observer far away from the black hole): Clocks closer to the black hole run more slowly. Time dilation becomes infinite at the event horizon. Event horizon
: Clocks closer to the black hole run more slowly. Time dilation becomes infinite at the event horizon. Event horizon.")
108
General Relativity Effects Near Black Holes (III)
gravitational redshift All wavelengths of emissions from near the event horizon are stretched (redshifted). Frequencies are lowered. Event horizon
. Frequencies are lowered. Event horizon.")
109
Observing Black Holes Mass > 3 Msun => Black hole!
No light can escape a black hole => Black holes can not be observed directly. If an invisible compact object is part of a binary, we can estimate its mass from the orbital period and radial velocity. Mass > 3 Msun => Black hole!

110
Compact object with > 3 Msun must be a black hole!
Compact object with > 3 Msun must be a black hole!

111
Gamma-Ray Bursts (GRBs)
Short (~ a few s), bright bursts of gamma-rays GRB of May 10, 1999: 1 day after the GRB 2 days after the GRB Later discovered with X-ray and optical afterglows lasting several hours – a few days Many have now been associated with host galaxies at large (cosmological) distances. Probably related to the deaths of very massive (> 25 Msun) stars.
, bright bursts of gamma-rays. GRB of May 10, 1999: 1 day after the GRB. 2 days after the GRB. Later discovered with X-ray and optical afterglows lasting several hours – a few days. Many have now been associated with host galaxies at large (cosmological) distances. Probably related to the deaths of very massive (> 25 Msun) stars.")
Similar presentations


 –main sequence location where stars are born Bottom/left edge of main.>")


